Research
I conduct and support research in the ocean sciences and product design. This allows a wider audience to understand the insights of the research which can lead to change through policy, design, and development. I also collect data, both in the biological and social sciences. Sometimes this means developing new equipment and adapting new methods to collect survey data, as I led and conducted underwater surveys for STINAPA and Reefcheck. I also do statistical analysis of data collected, both in the traditional sciences and as a part of product design. Publication of research is an important contribution to the wider body of knowledge and it’s a way I help further our scientific understanding of the world we live in. The rigor necessary in formal research helps me draw meaningful and logical conclusions from the informal user studies I regularly conduct as part of my product design work.
University of Queensland
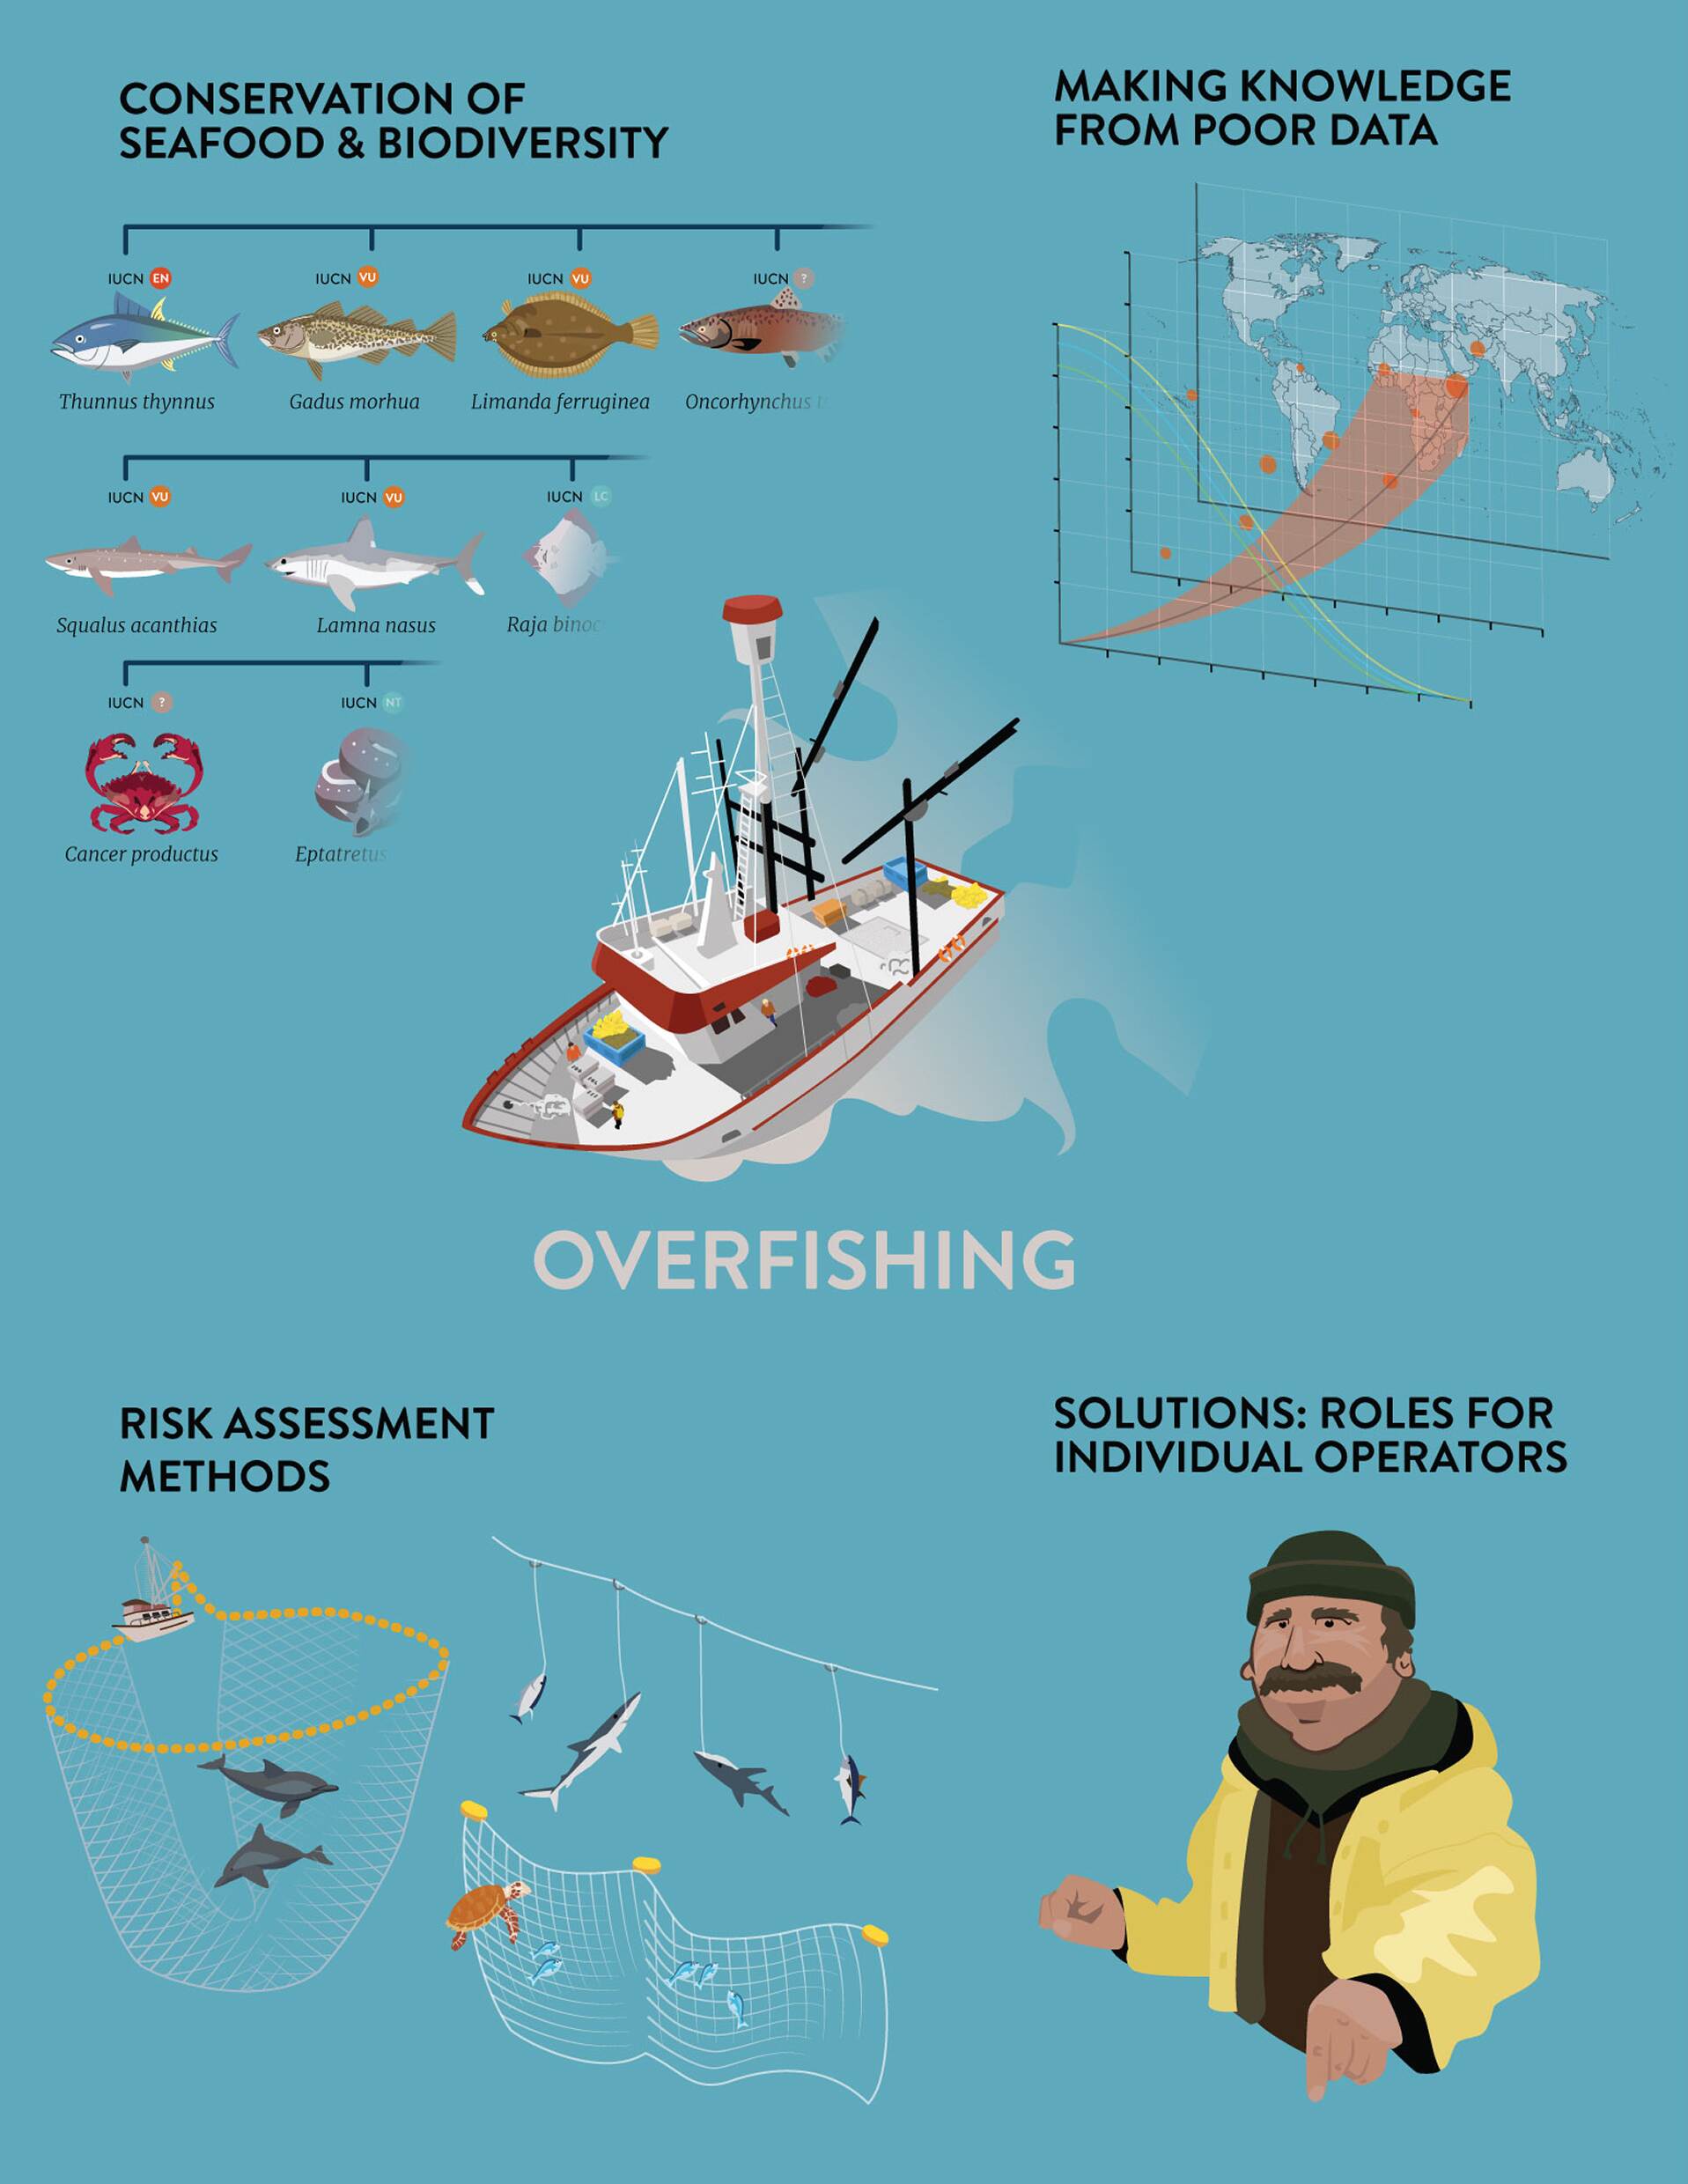
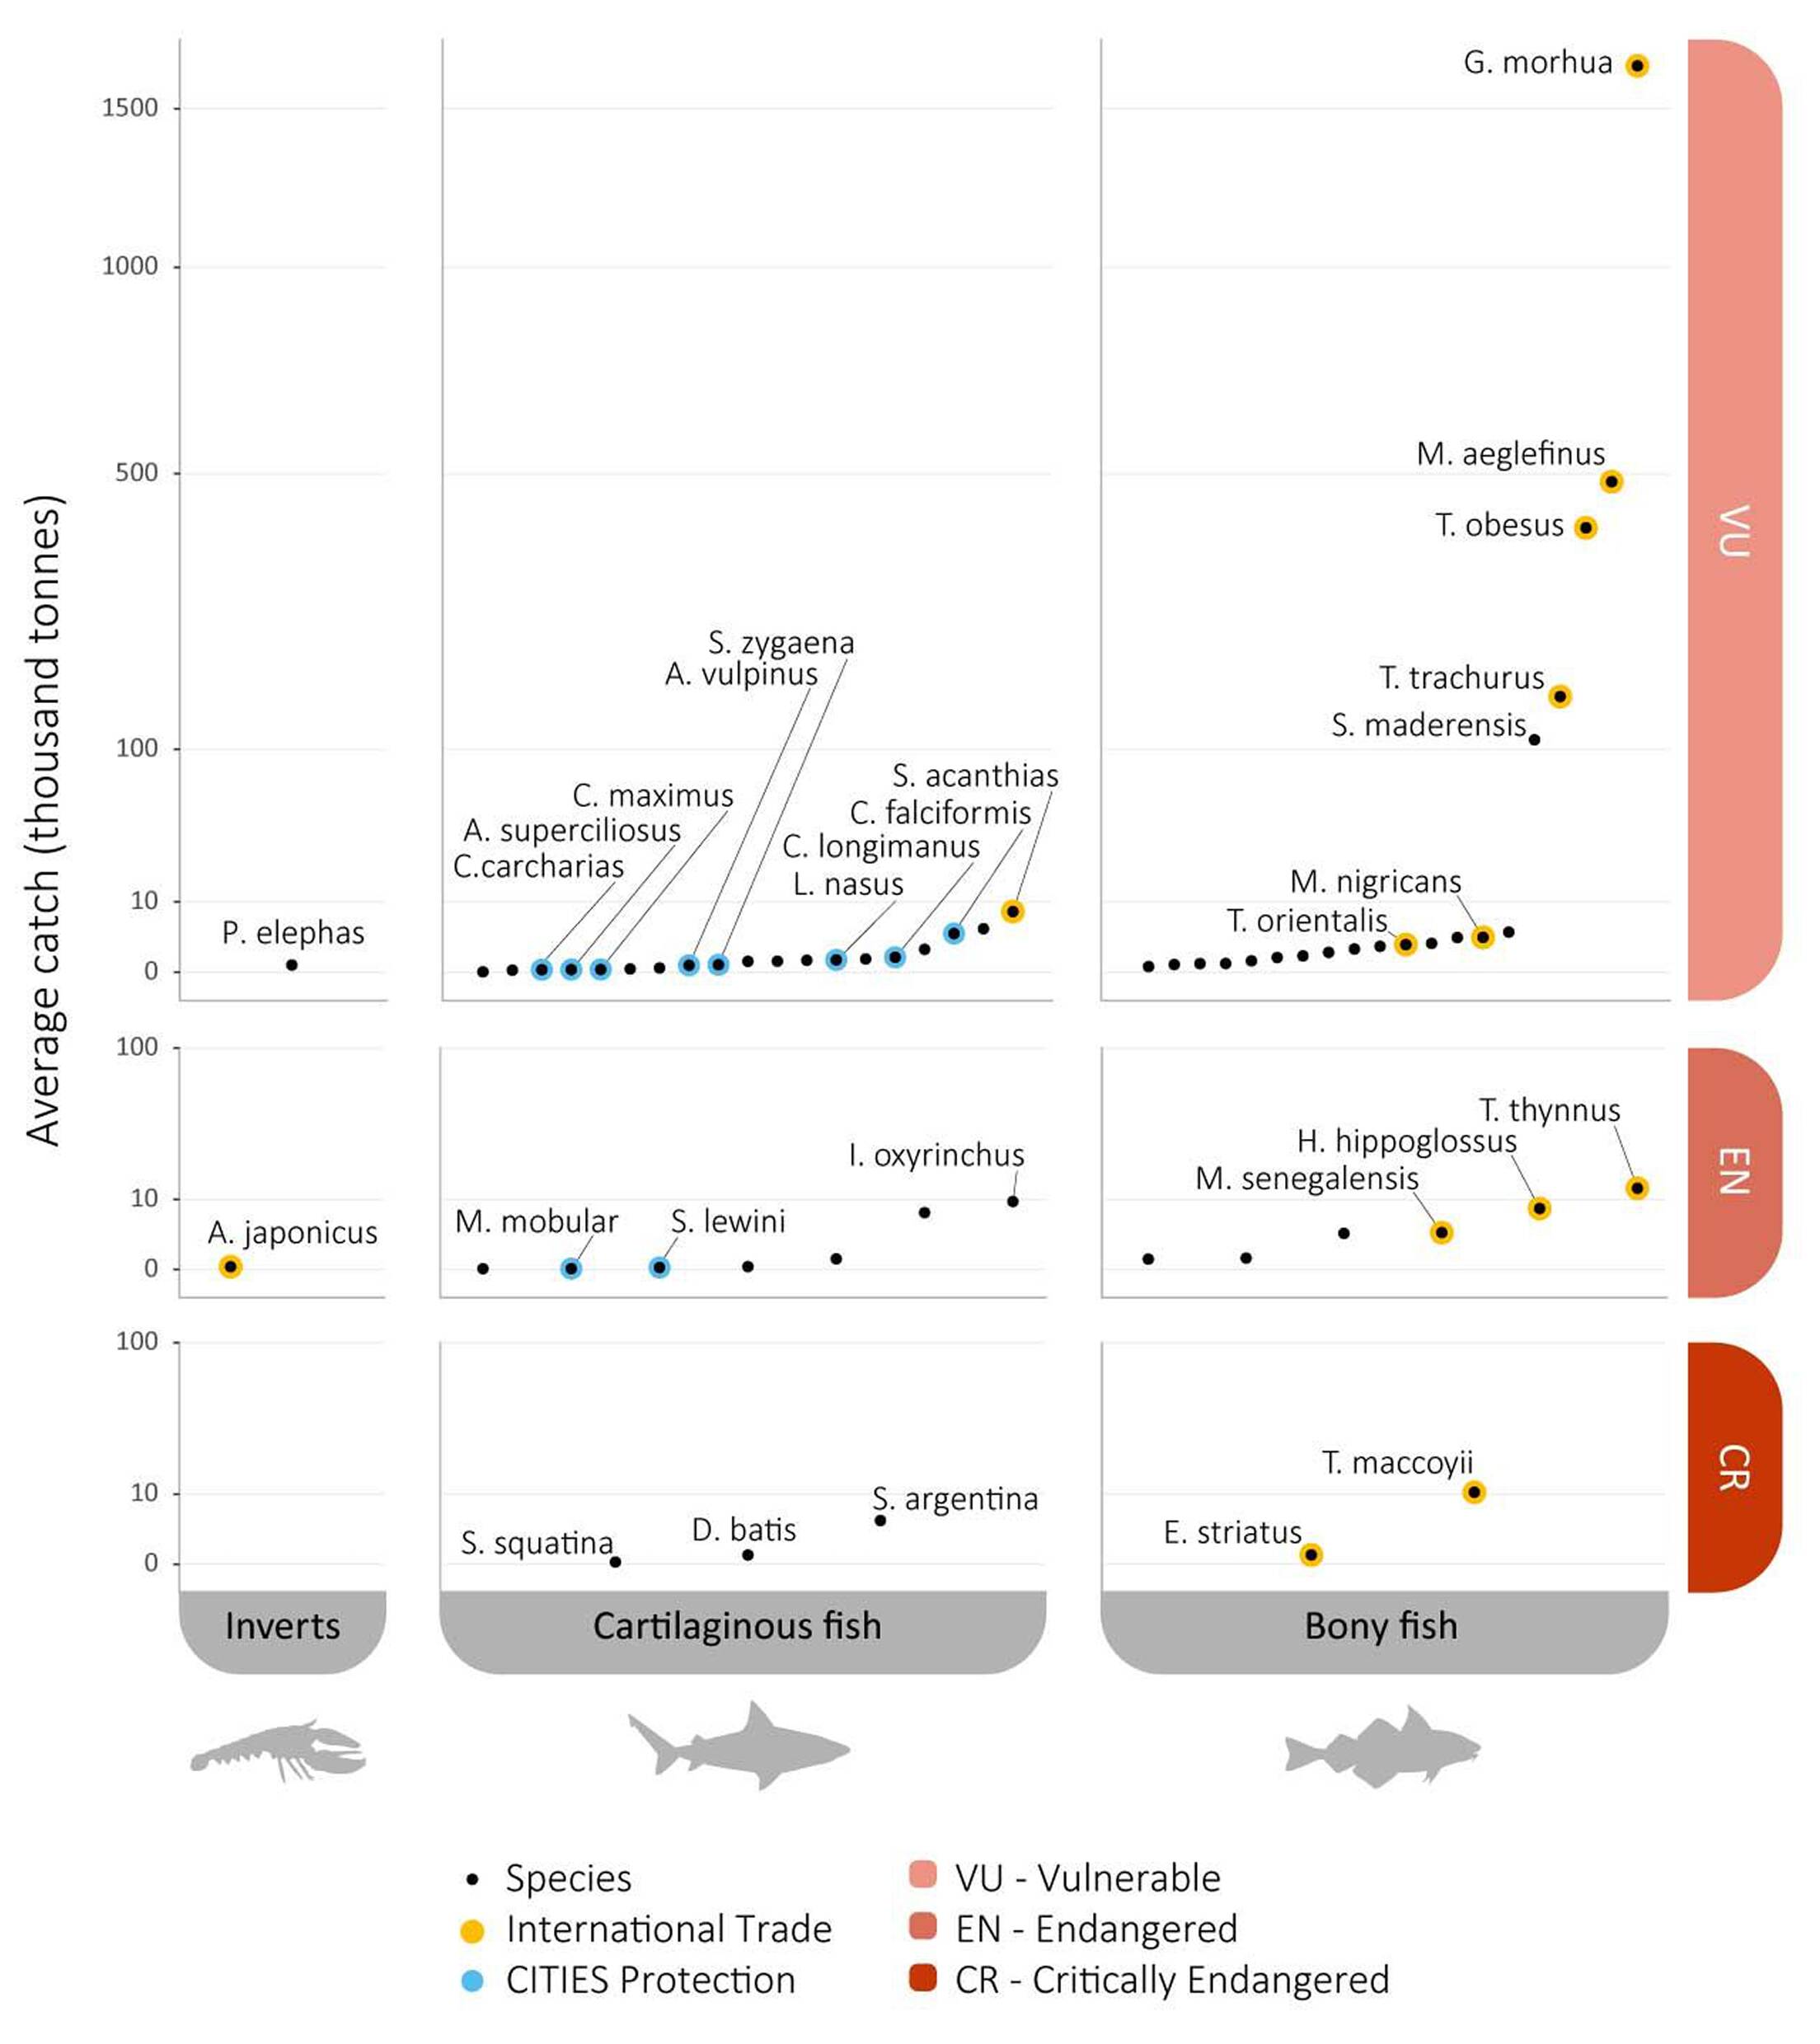
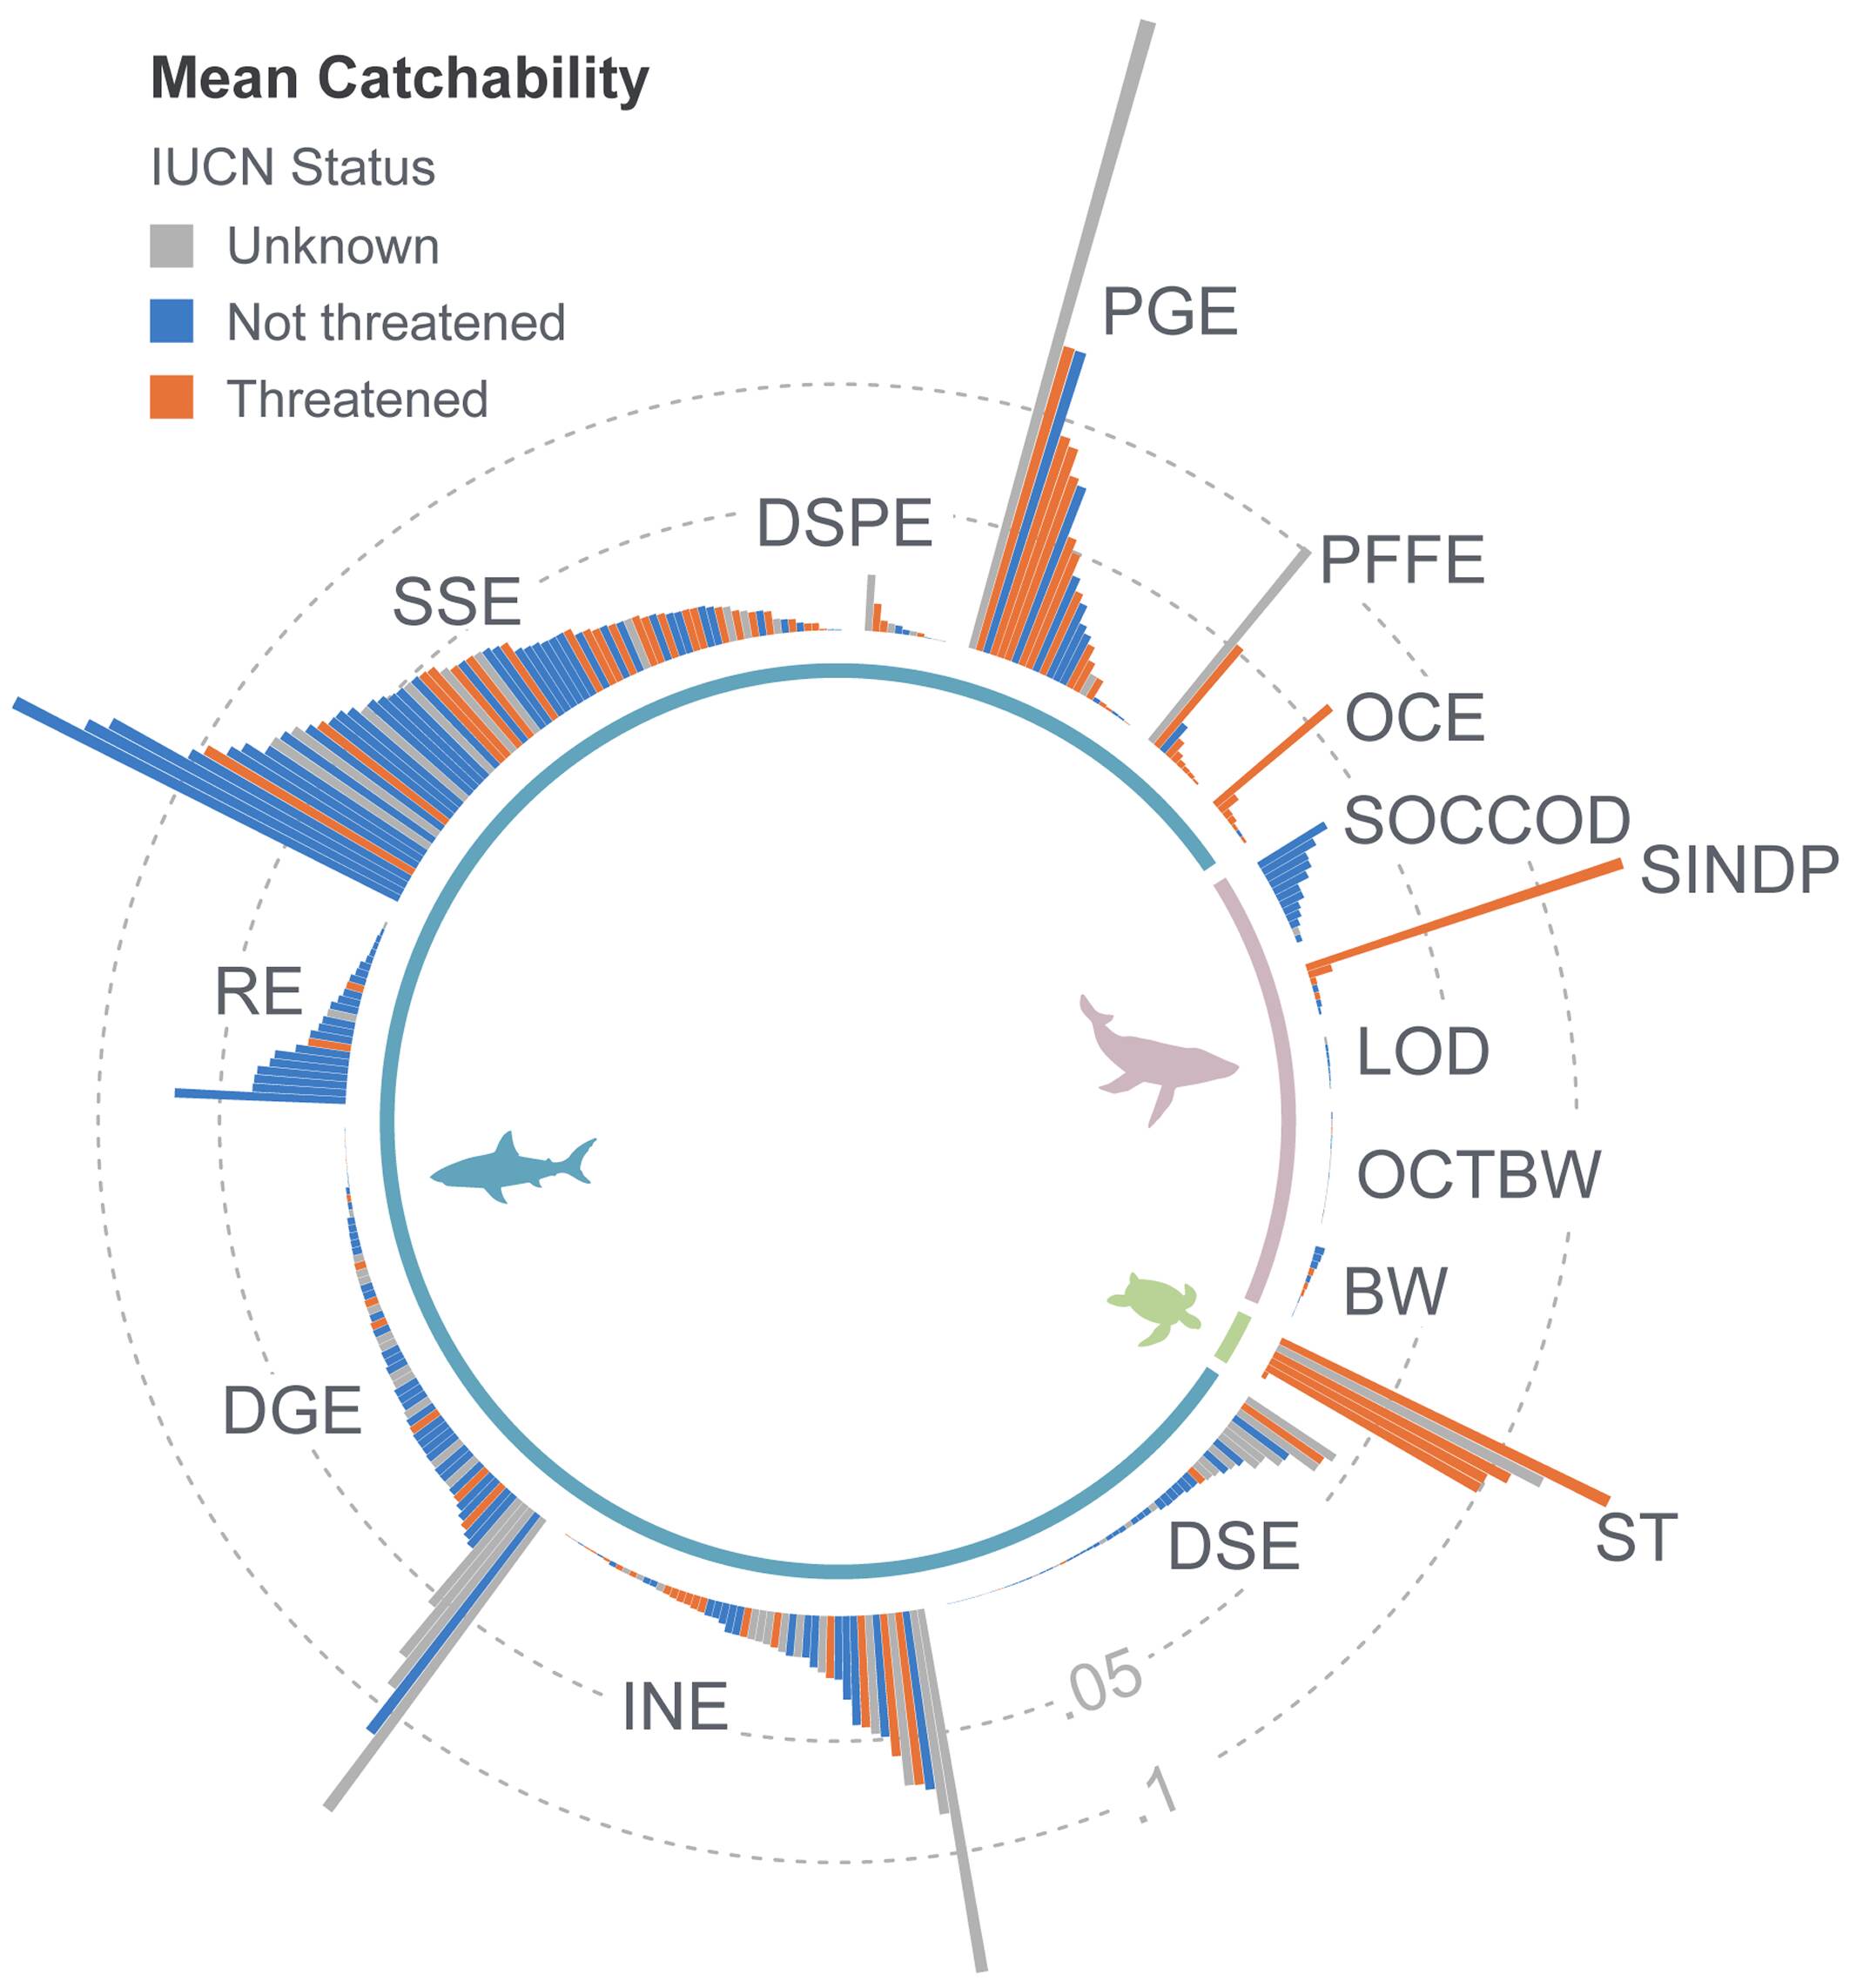
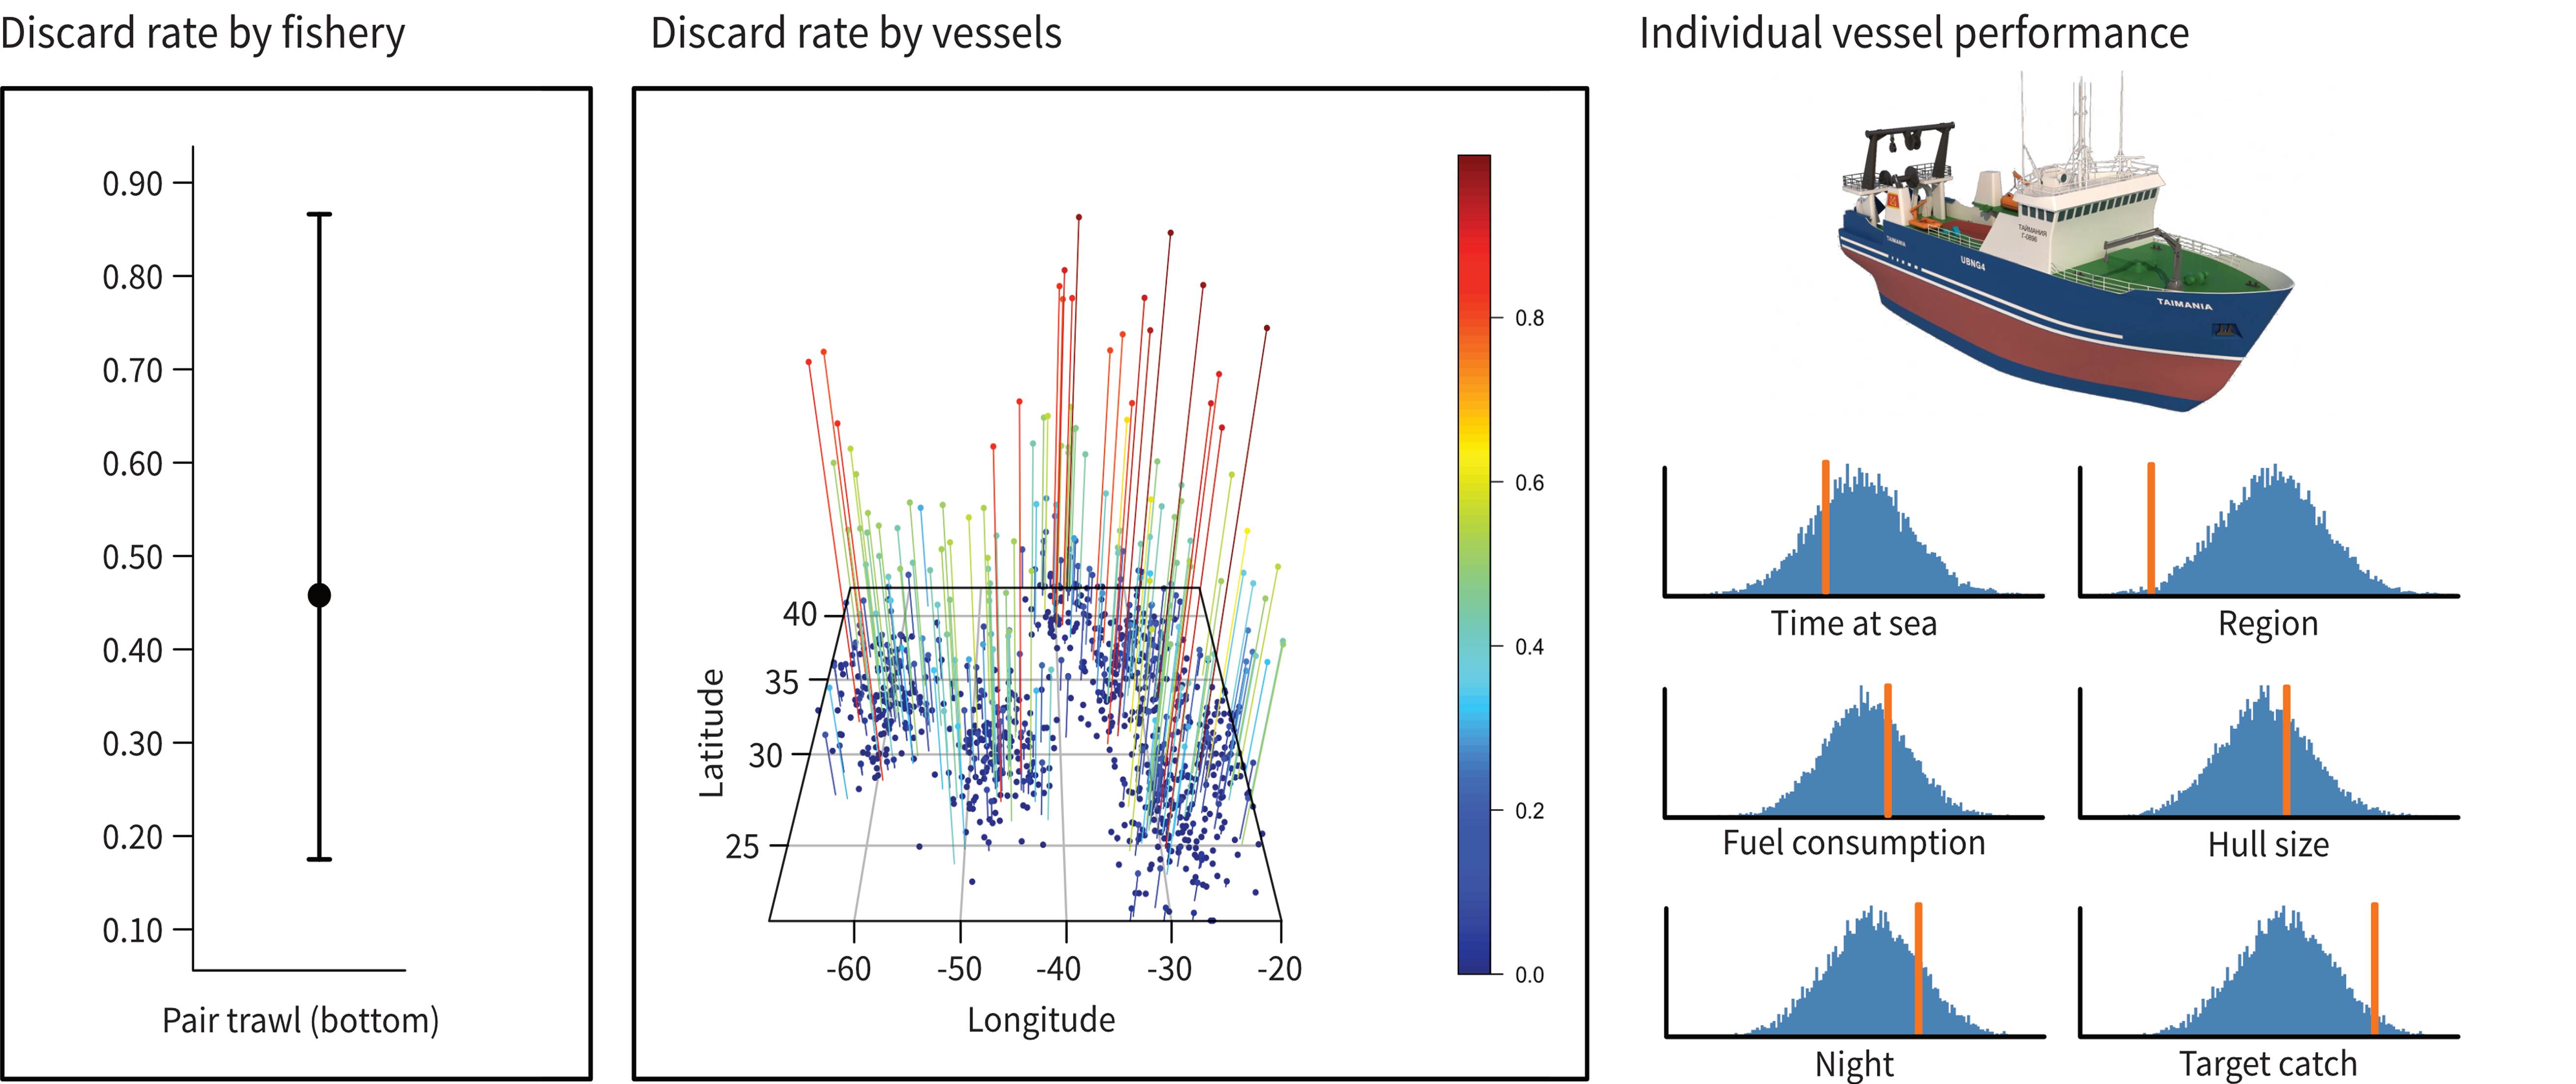
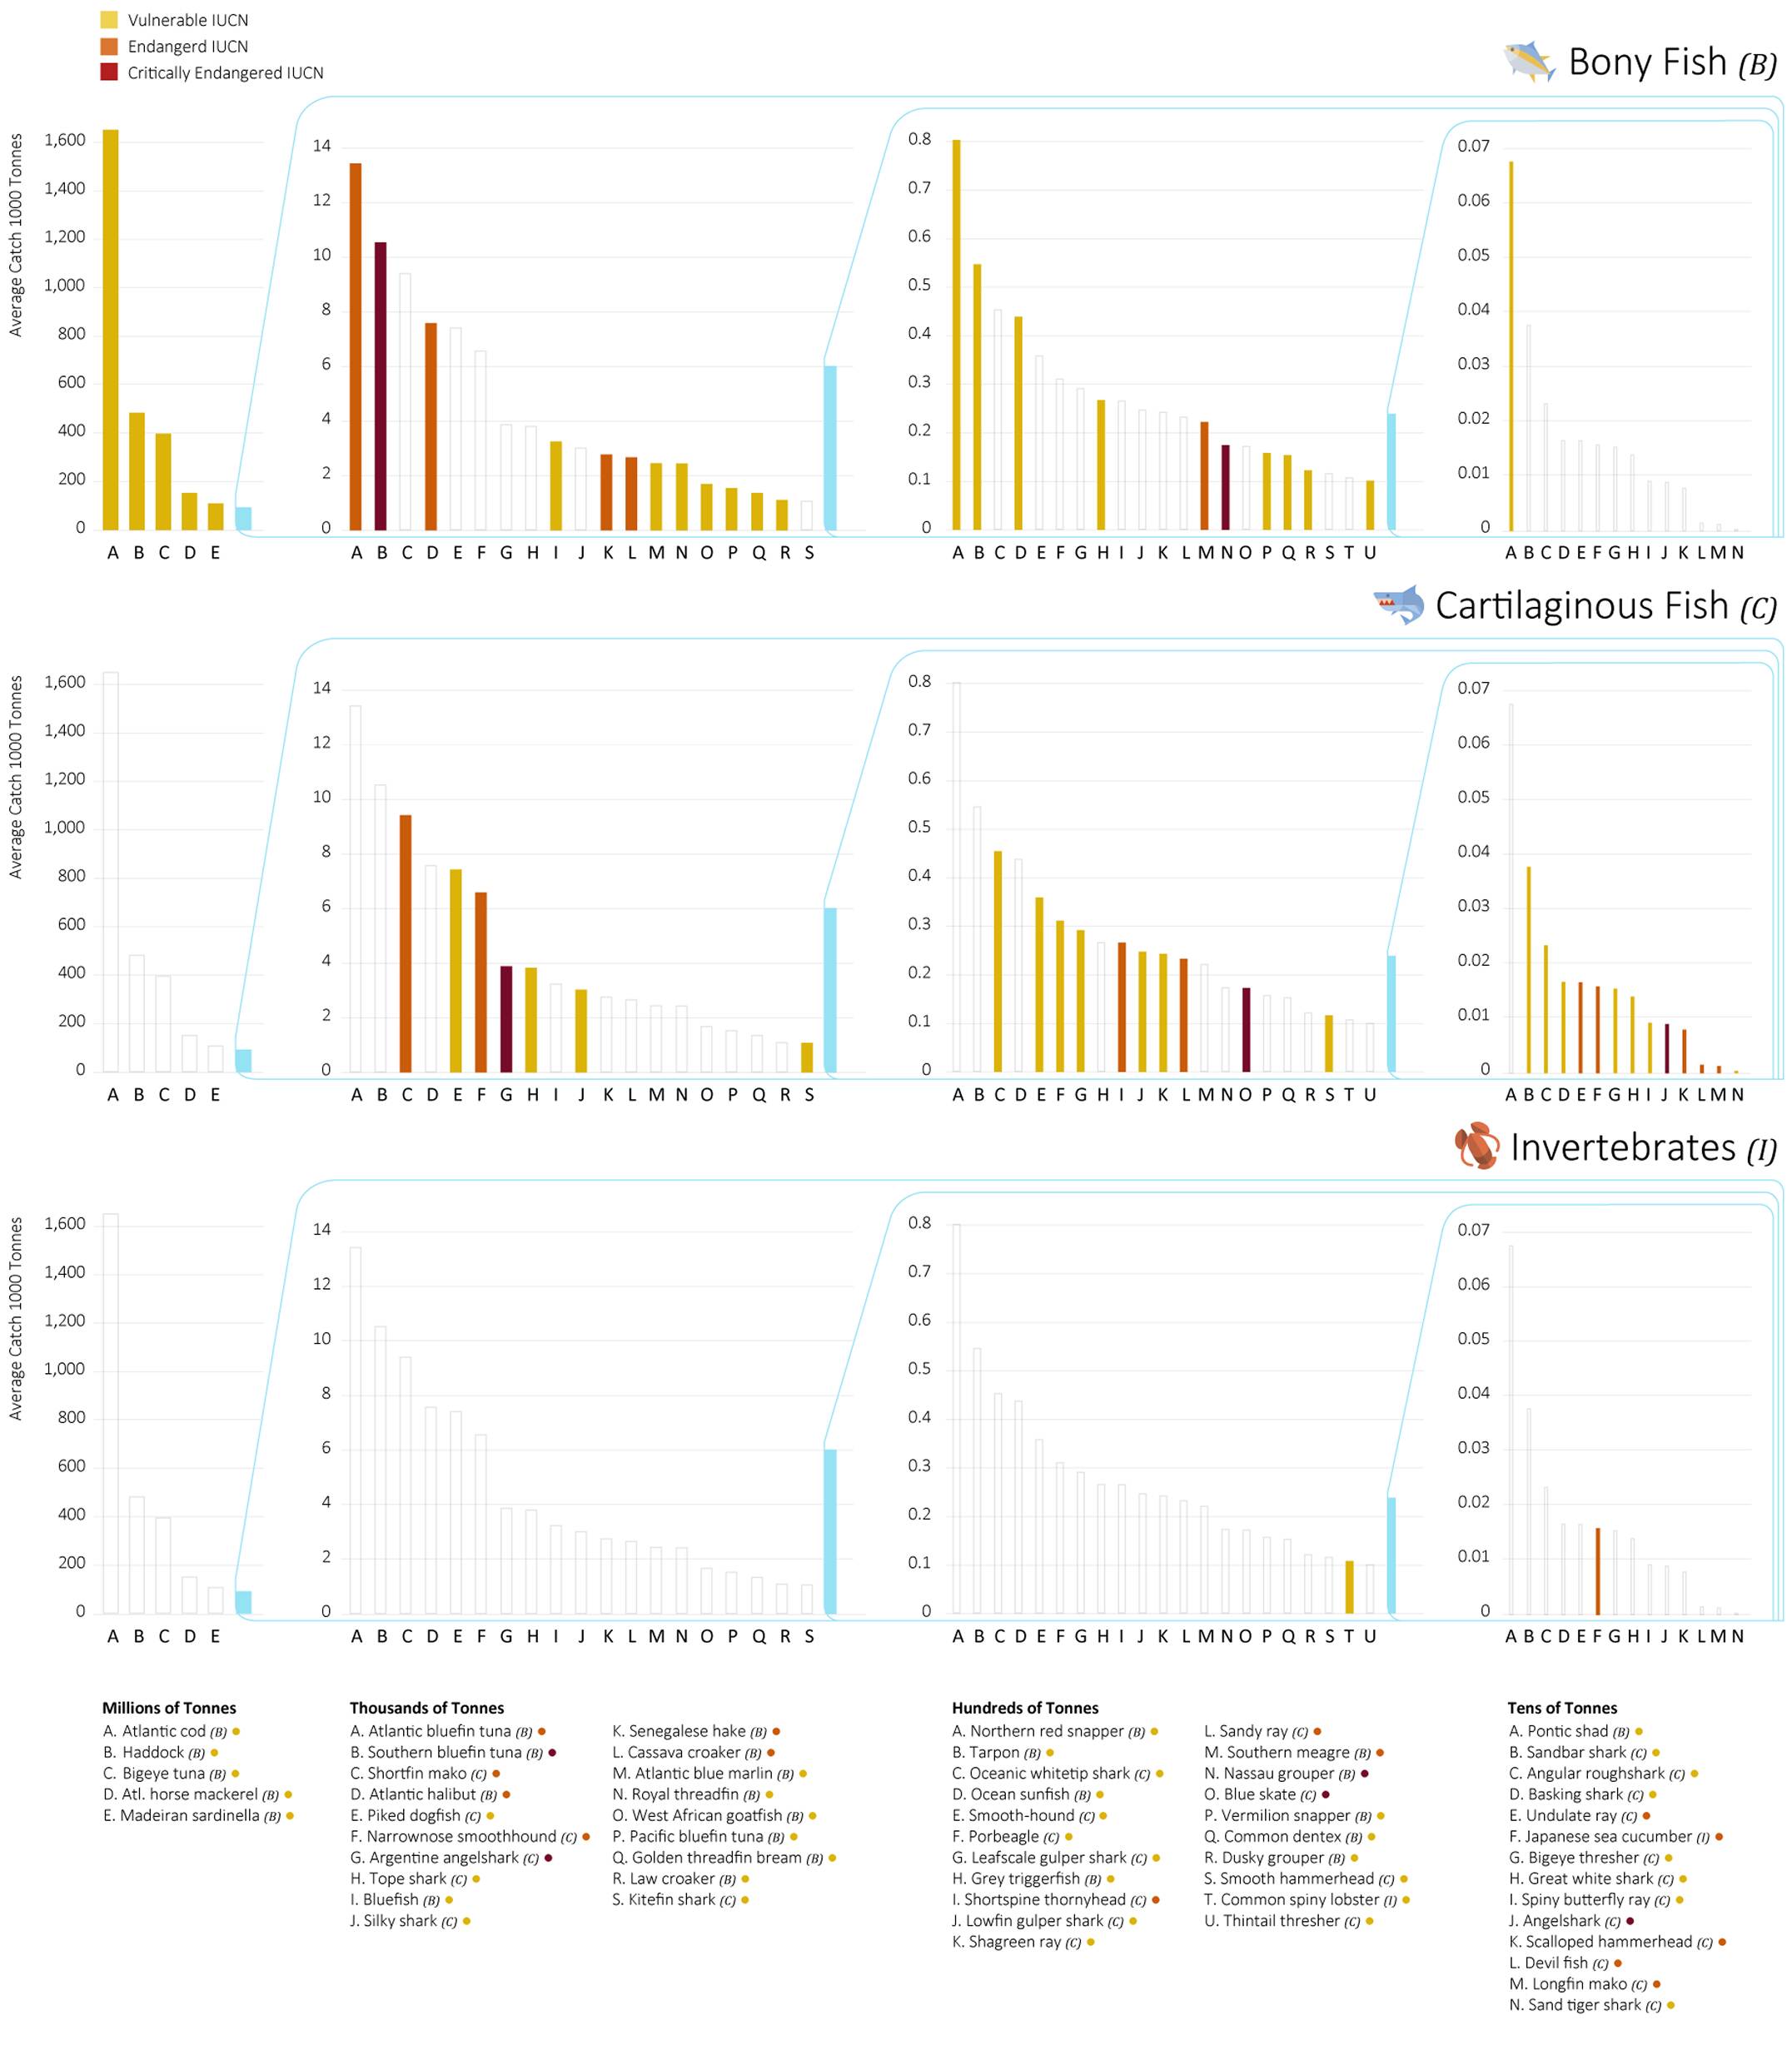
Communication of results often takes the form of visualizing data through graphing and illustration as I show in these examples from collaborations with the University of Queensland. This work centers on fisheries efficiency and reducing bycatch. These graphs were made in R Studio and then imported into a vector editing program (Illustrator and Affinity) for the final layout.
Human Health
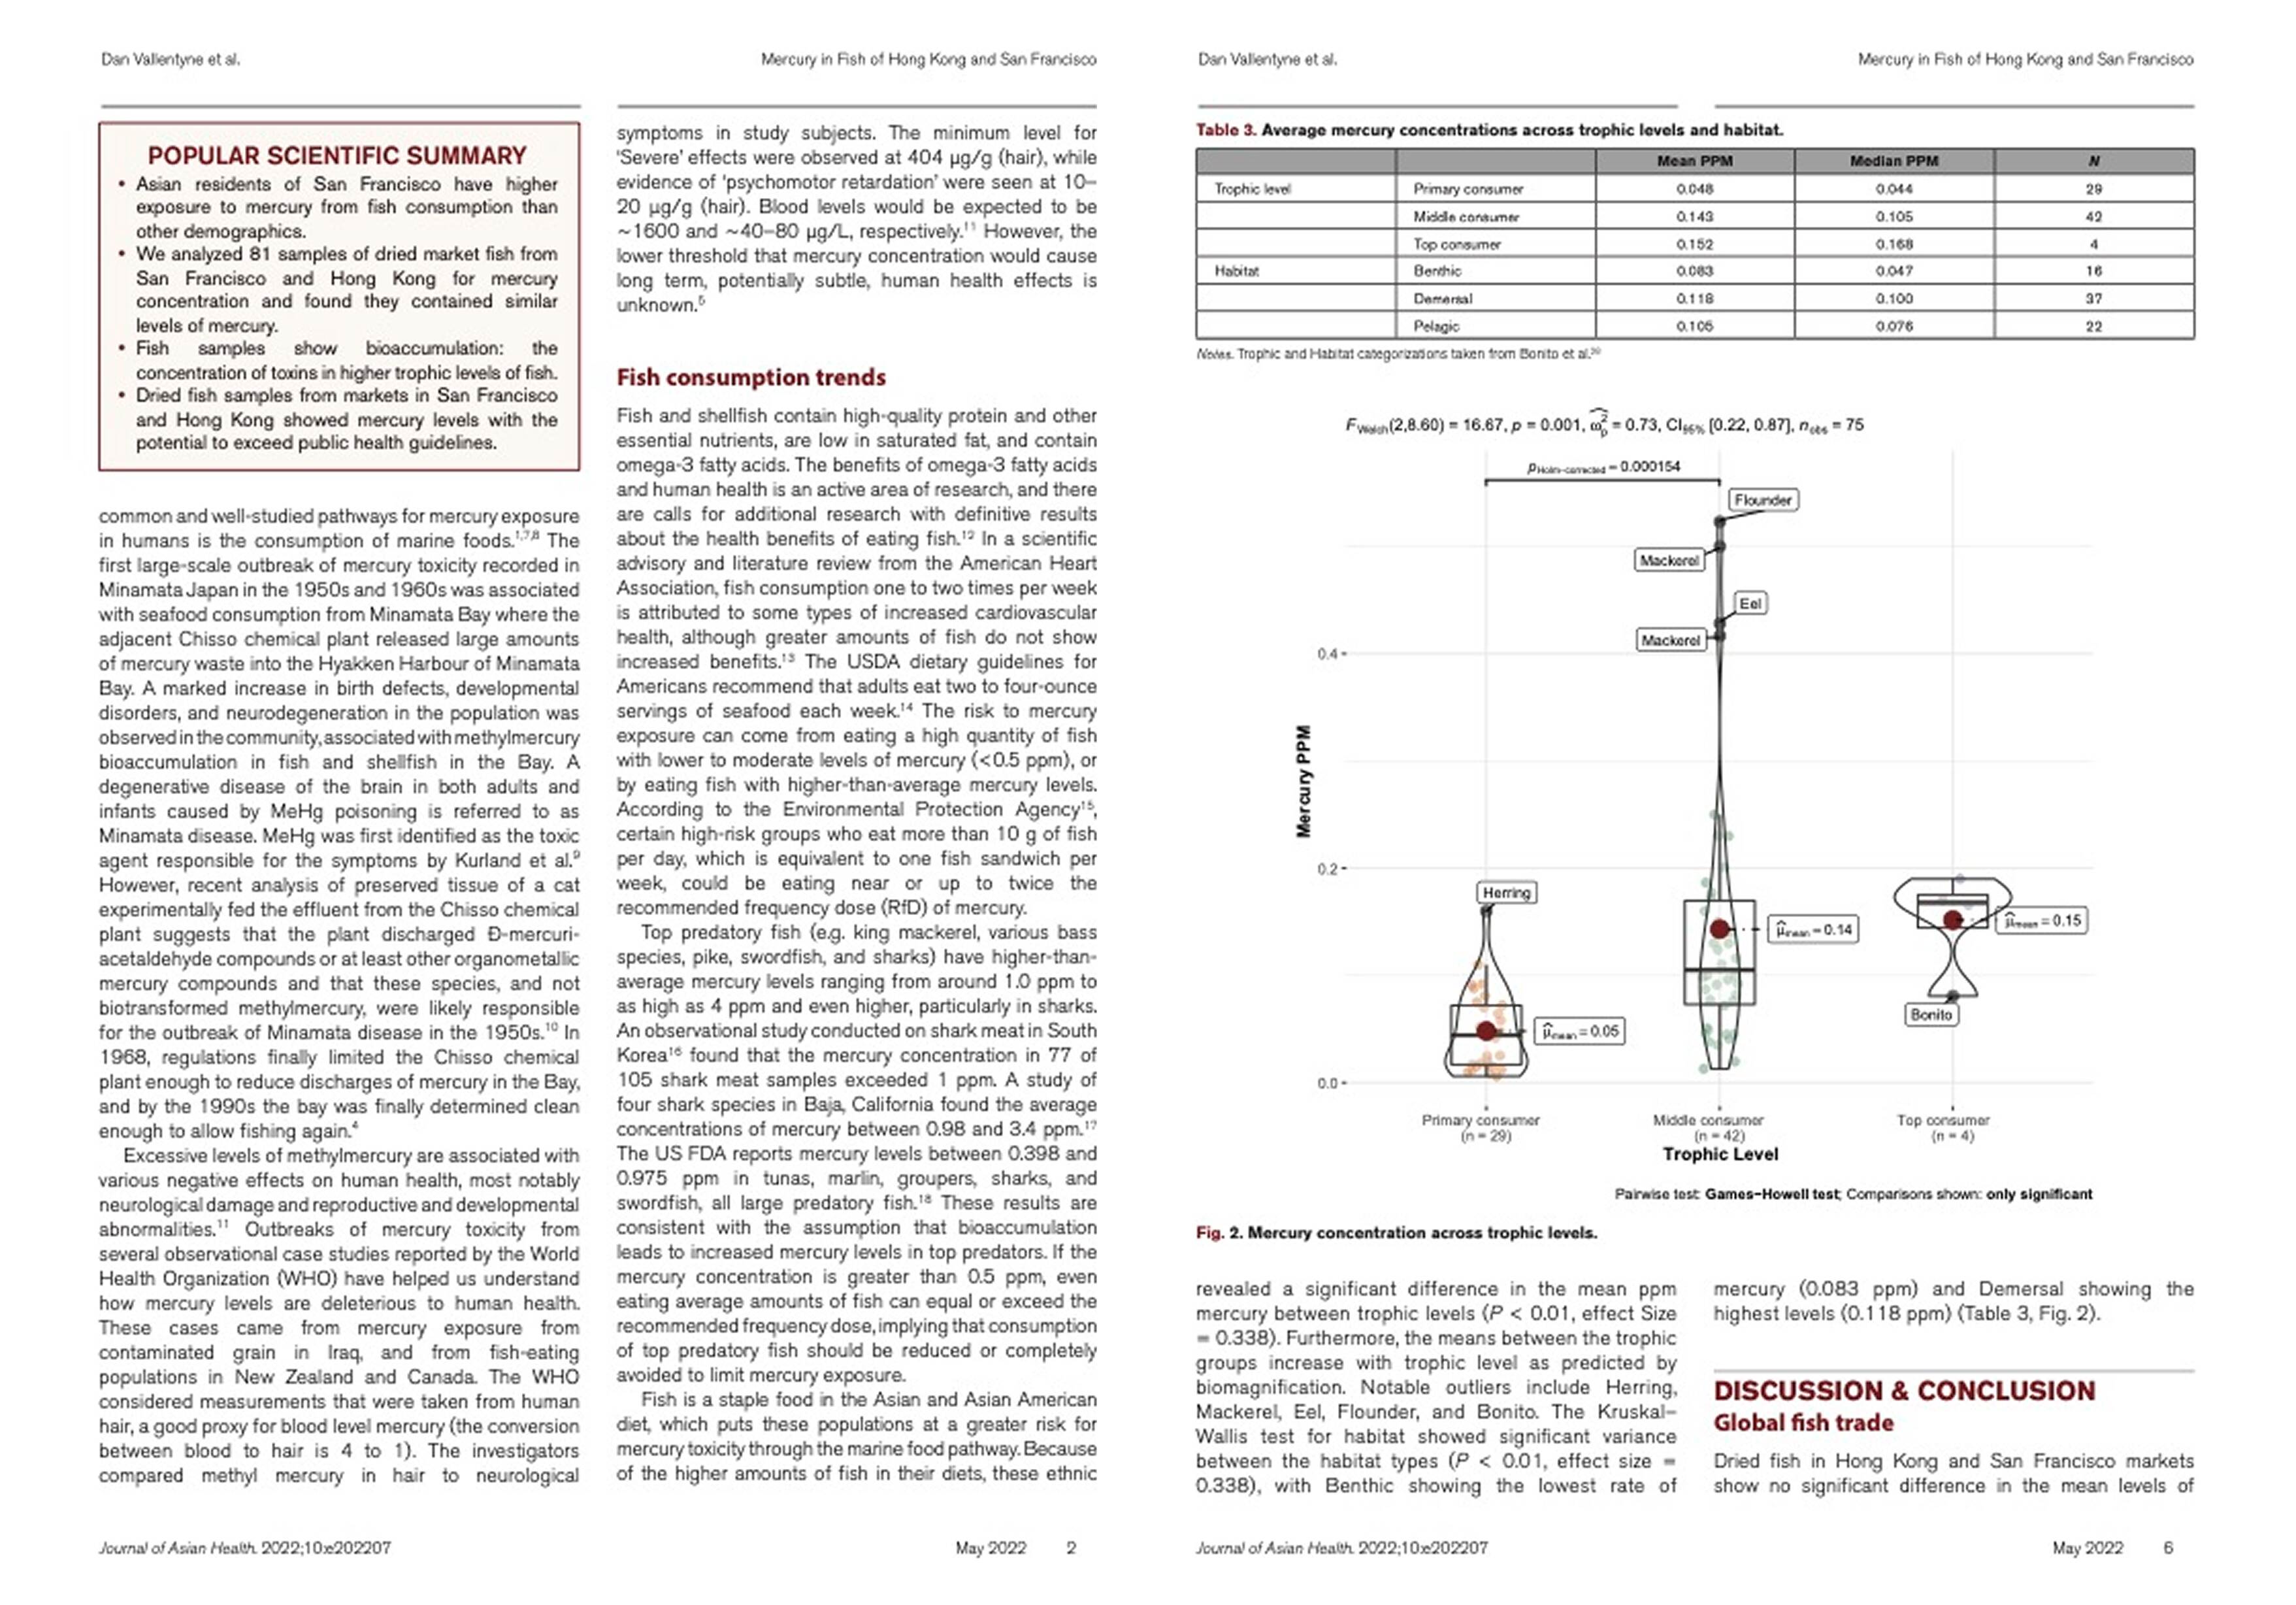
In collaboration with Shark Stewards I authored a paper on the presence of methyl mercury in food, investigating a discrepancy in blood mercury levels between asian decedents in San Francisco and Hong Kong. My work begin with an analysis of a data set on methyl mercury in dried fish from markets in San Francisco and Hong Kong. This required a literature review of the existing of mercury in human health studies (which are extensive), a statistical analysis on the data set collected for this study, and a discussion on the significance of our findings.
Photogrammetry
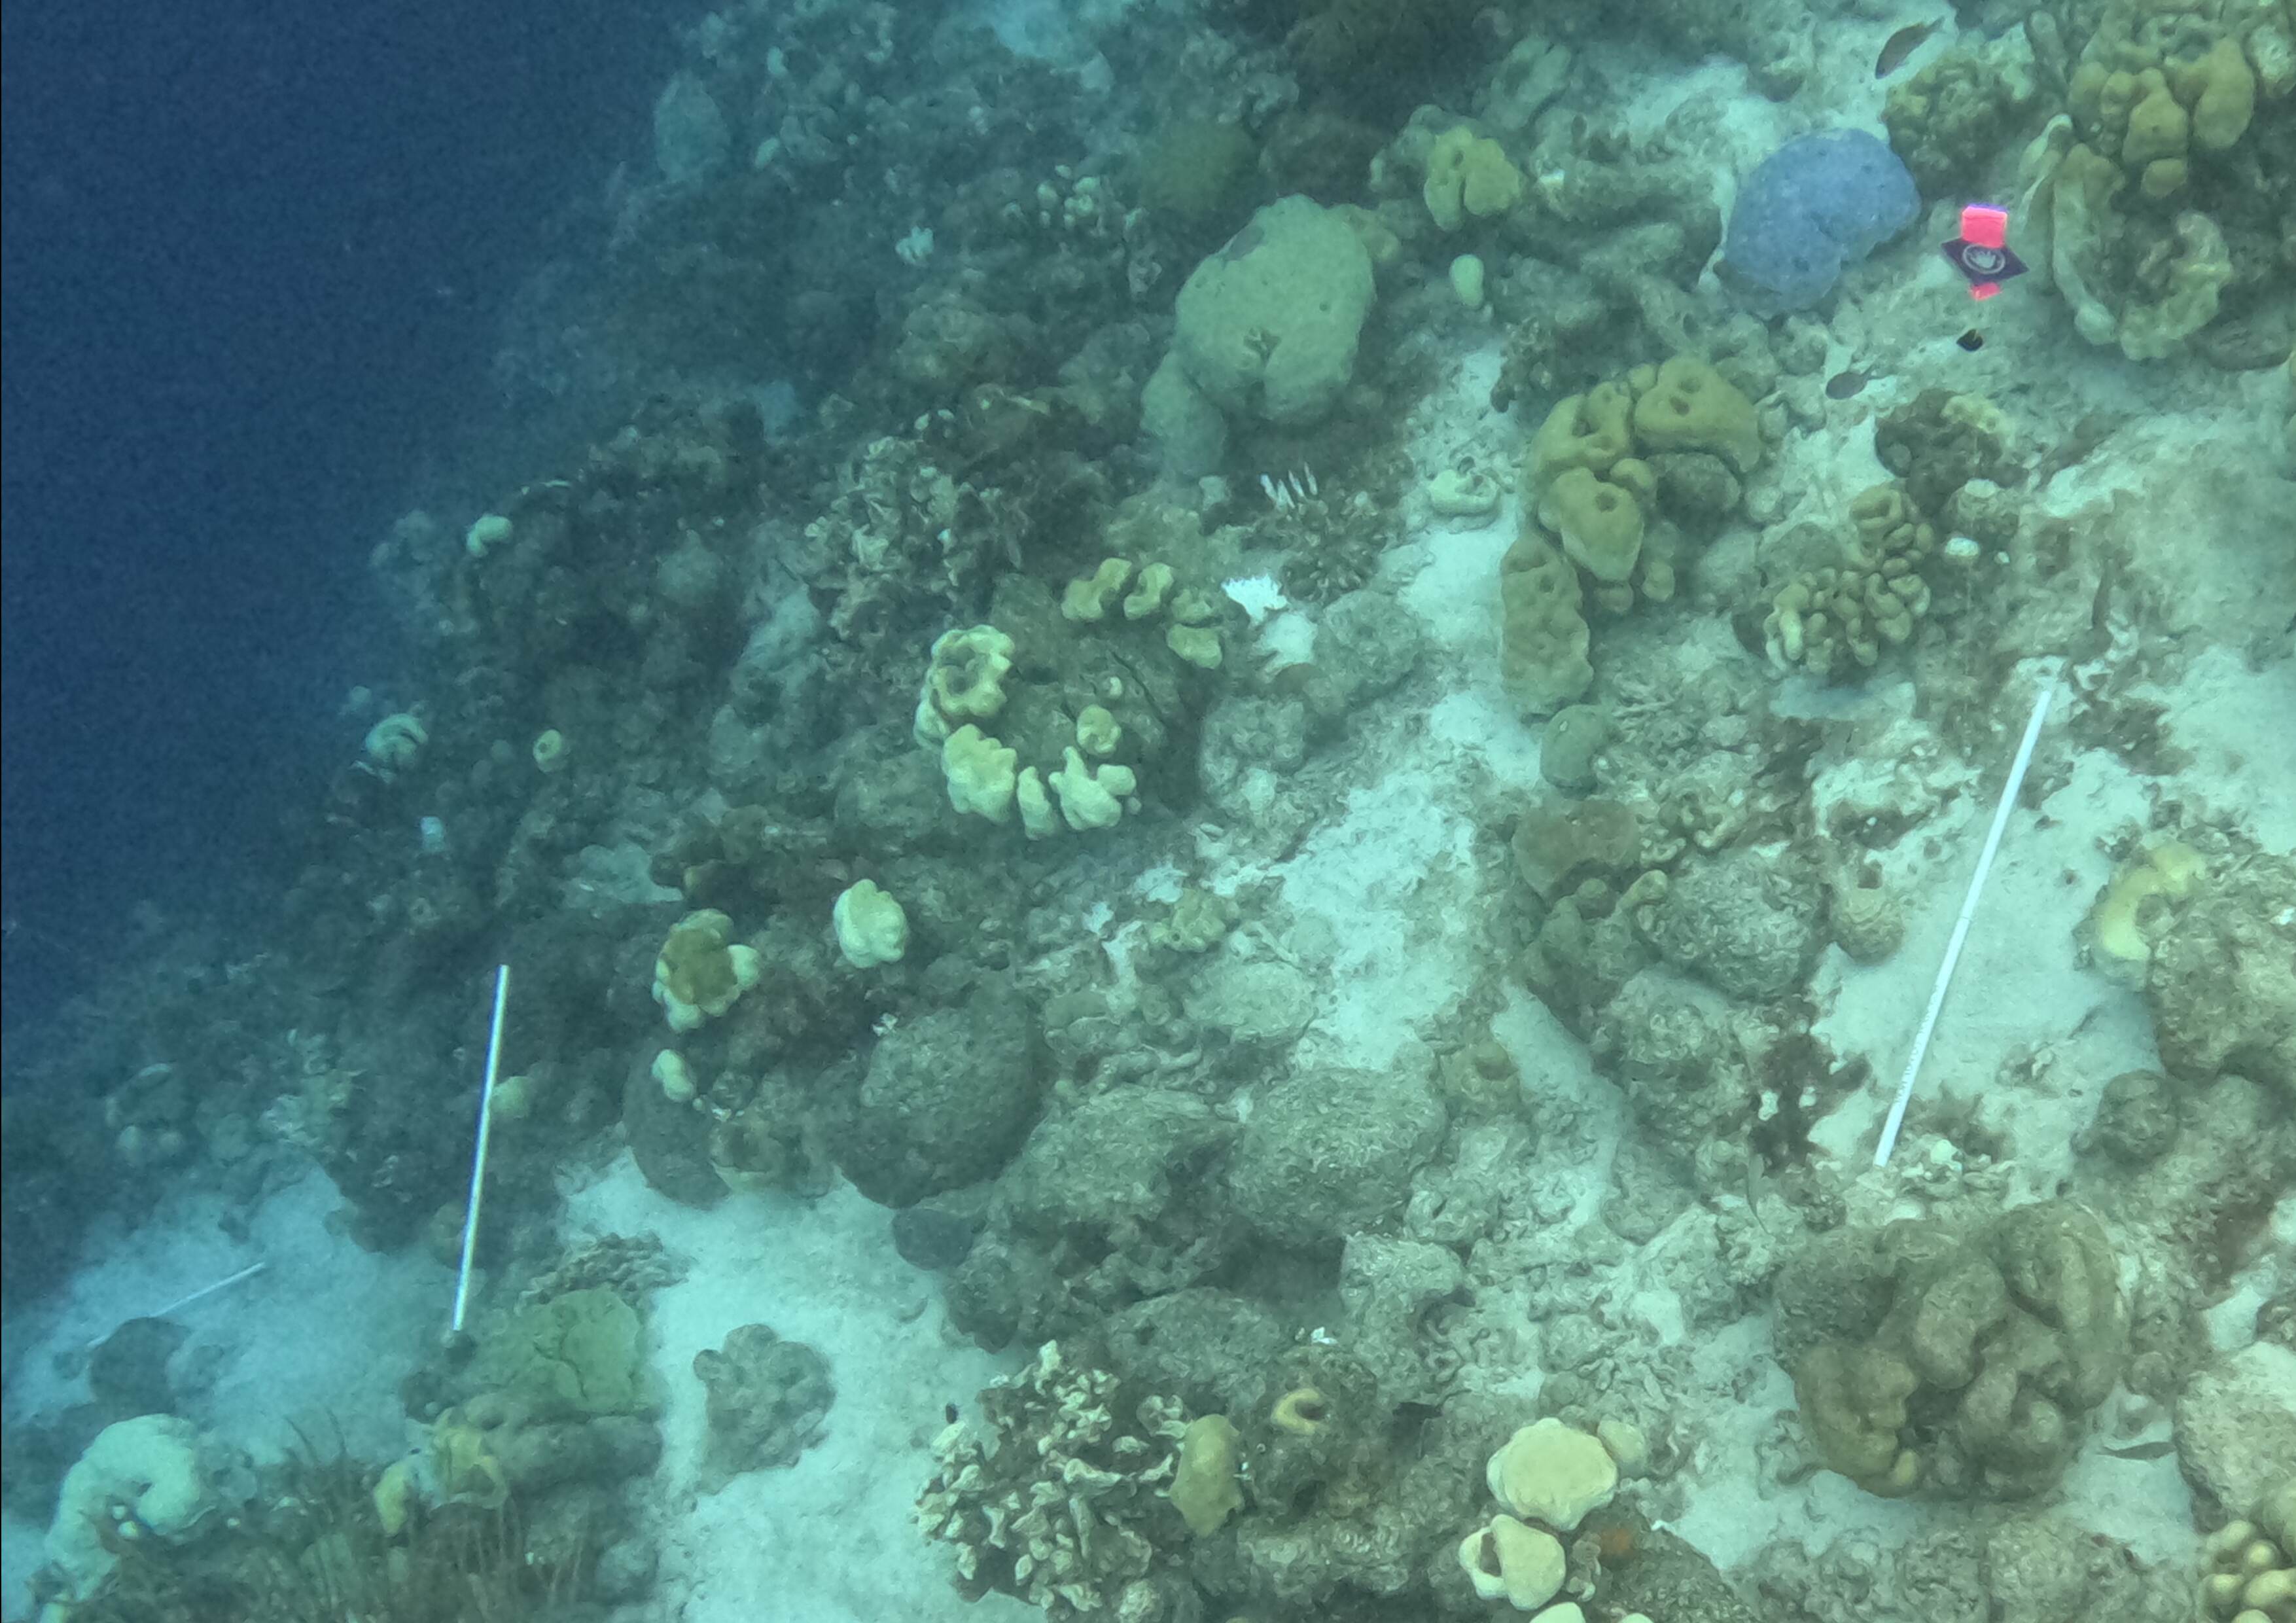
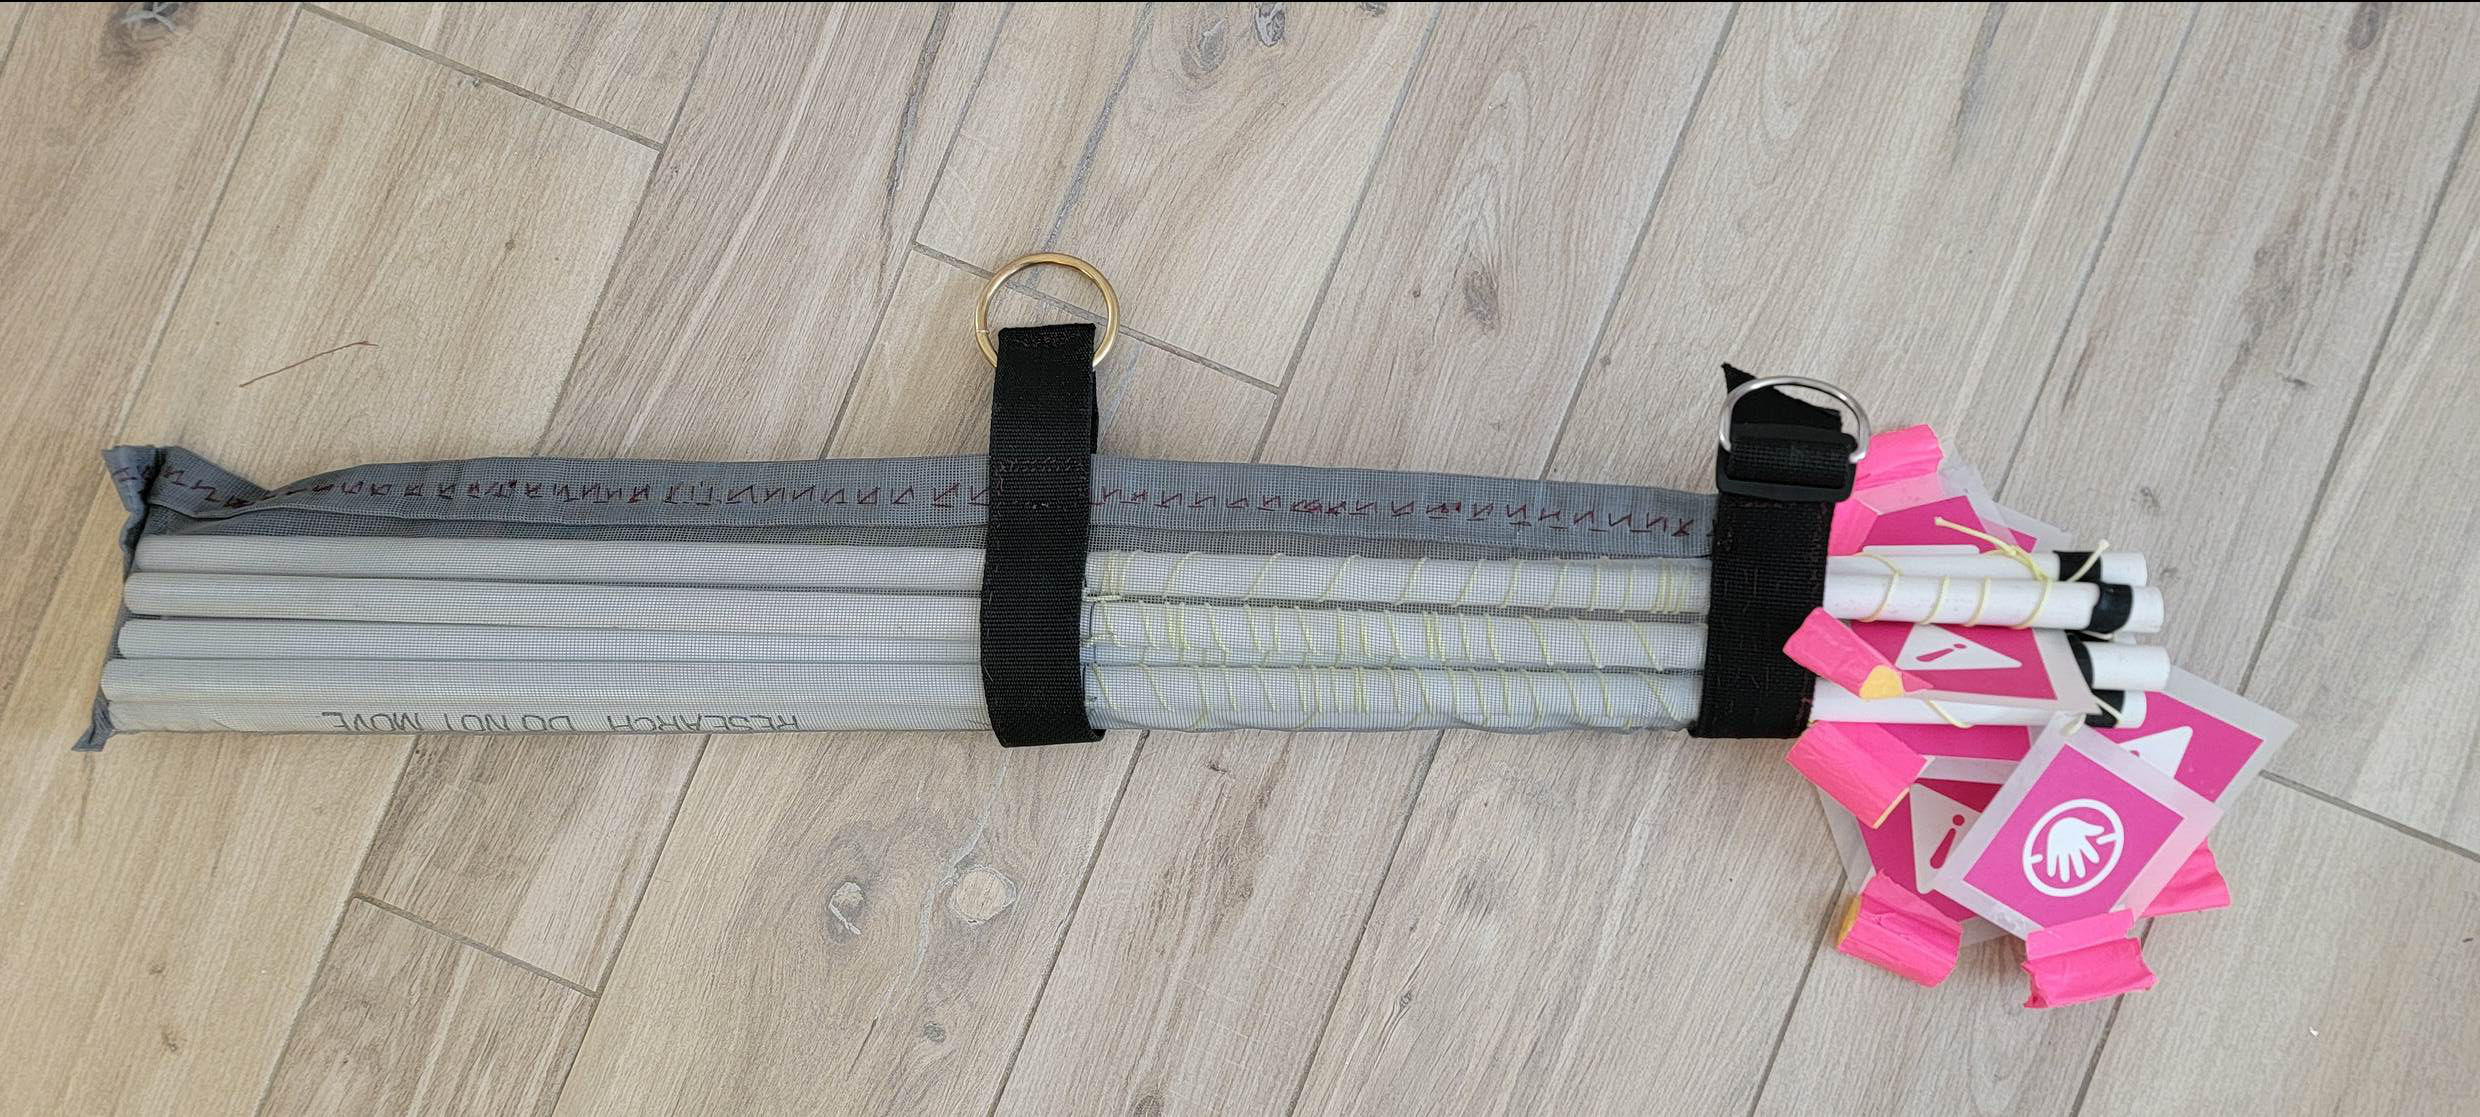
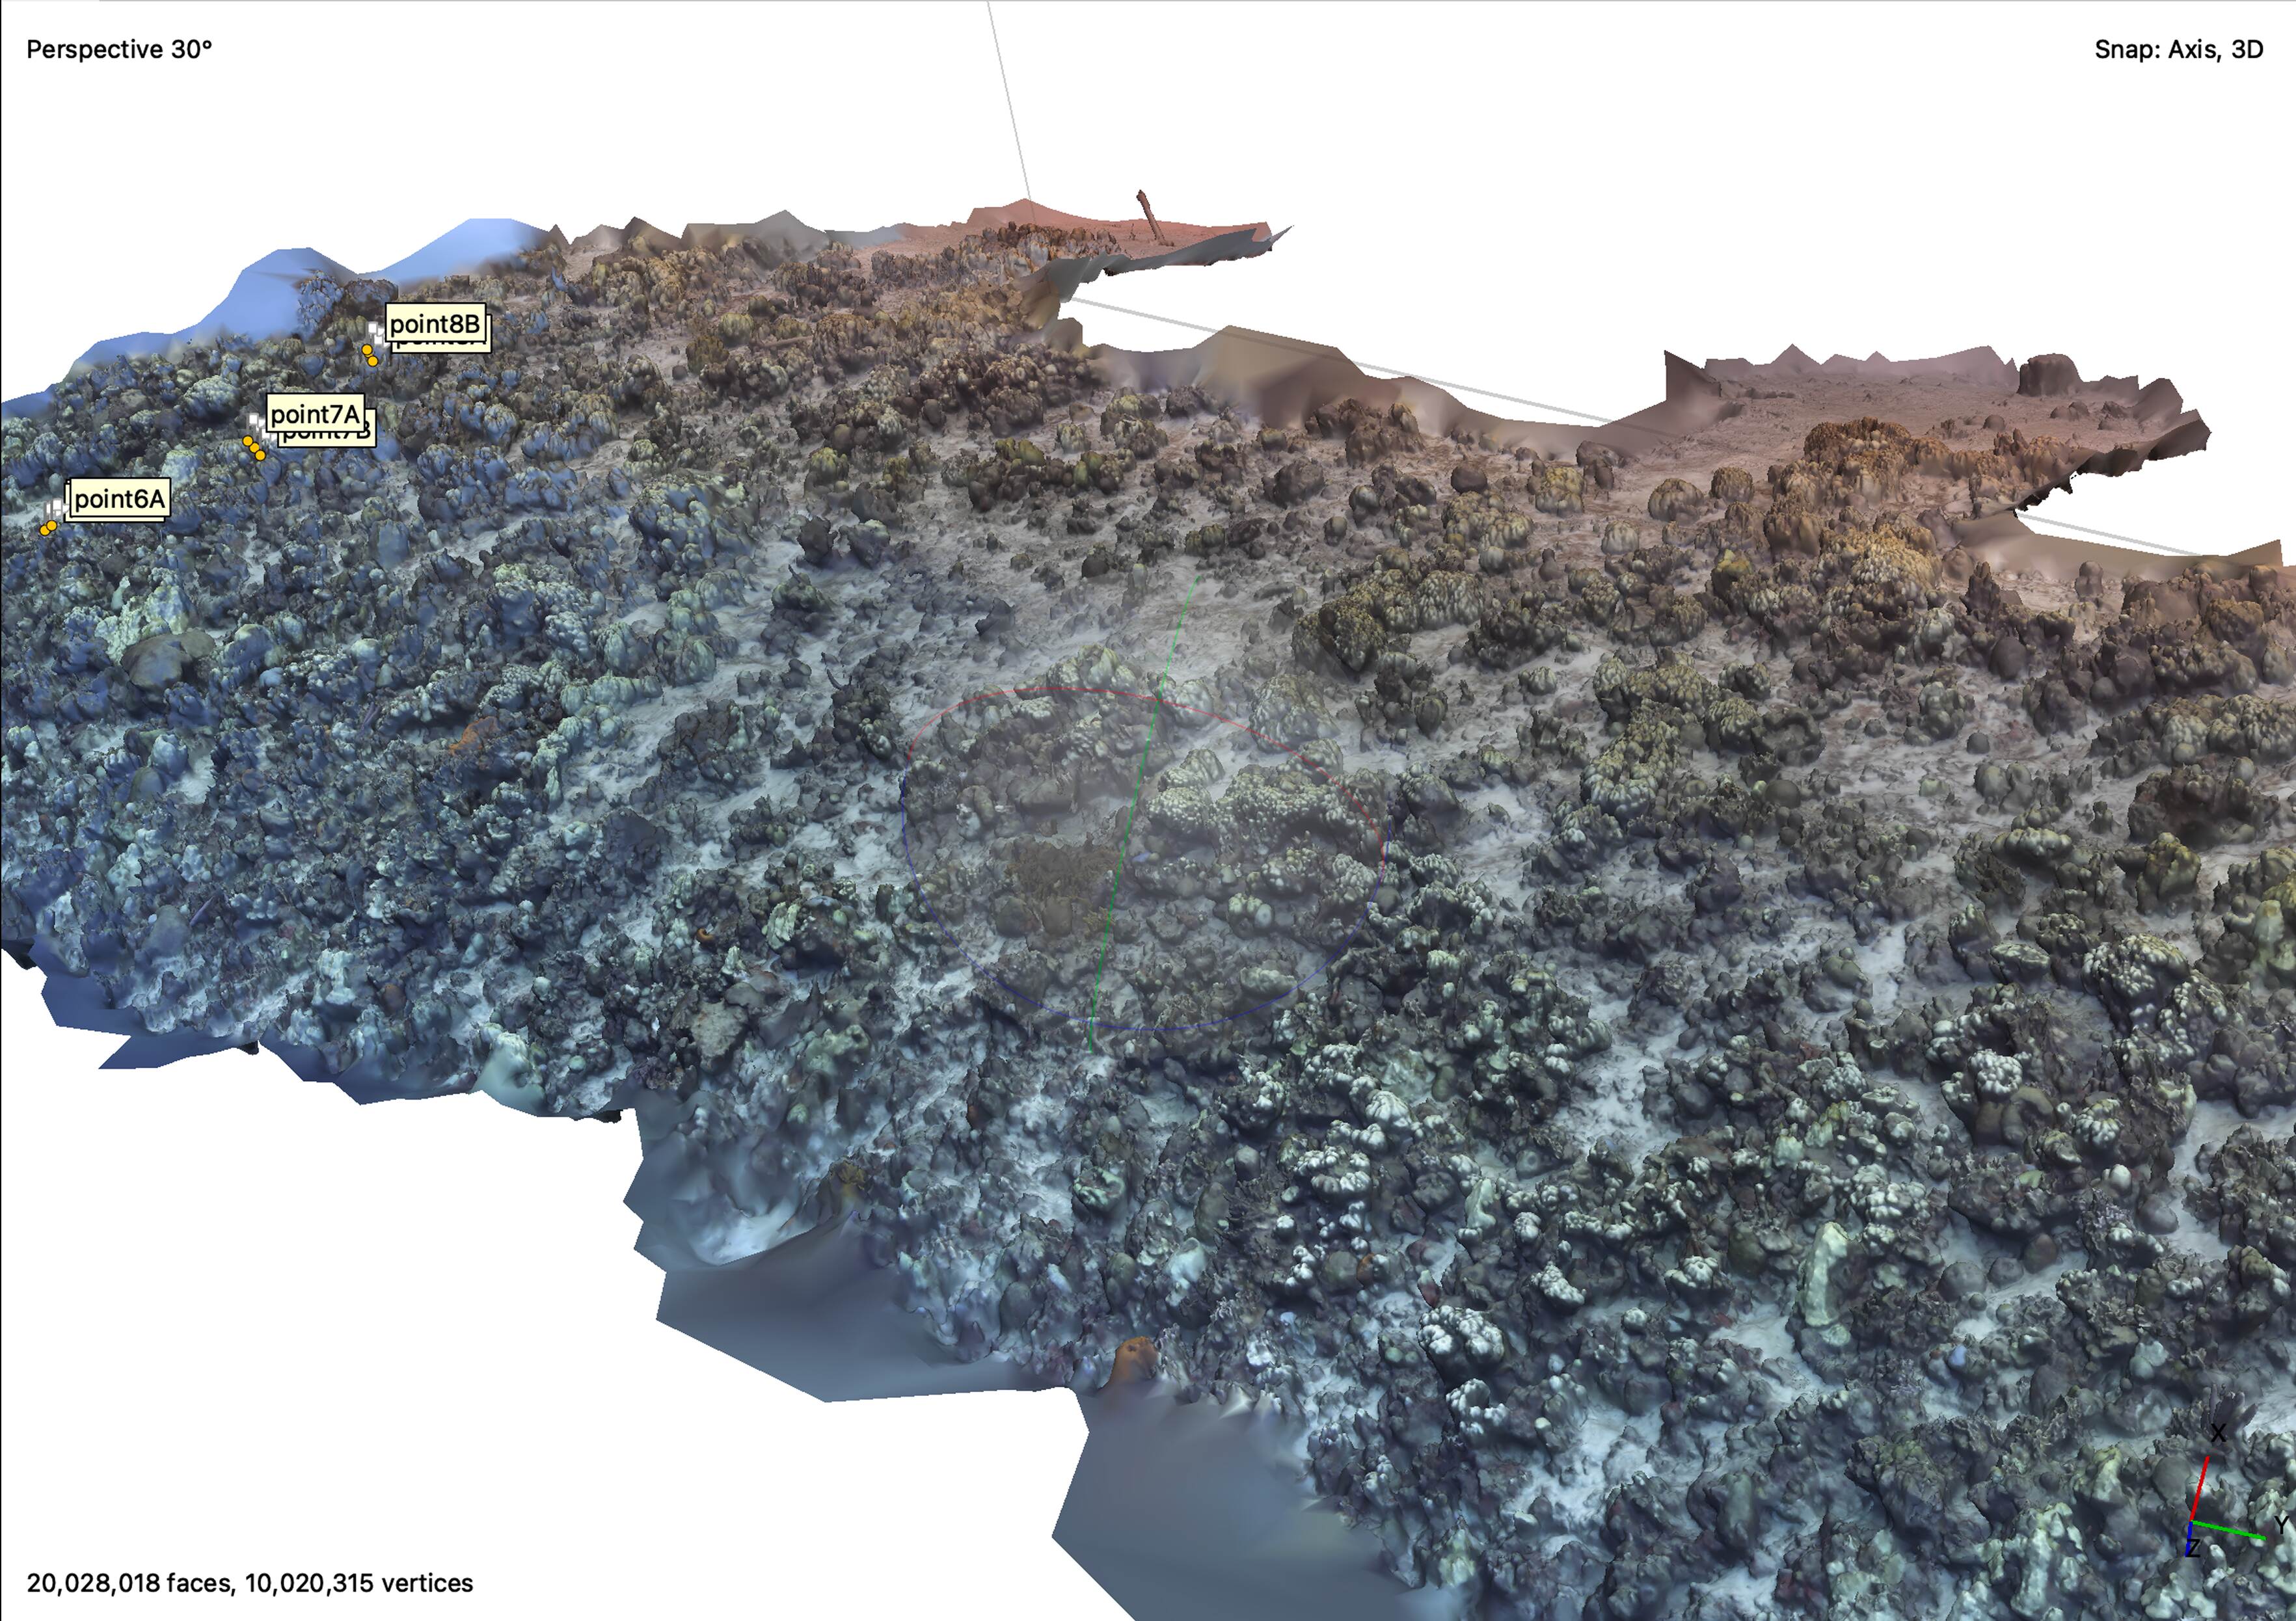
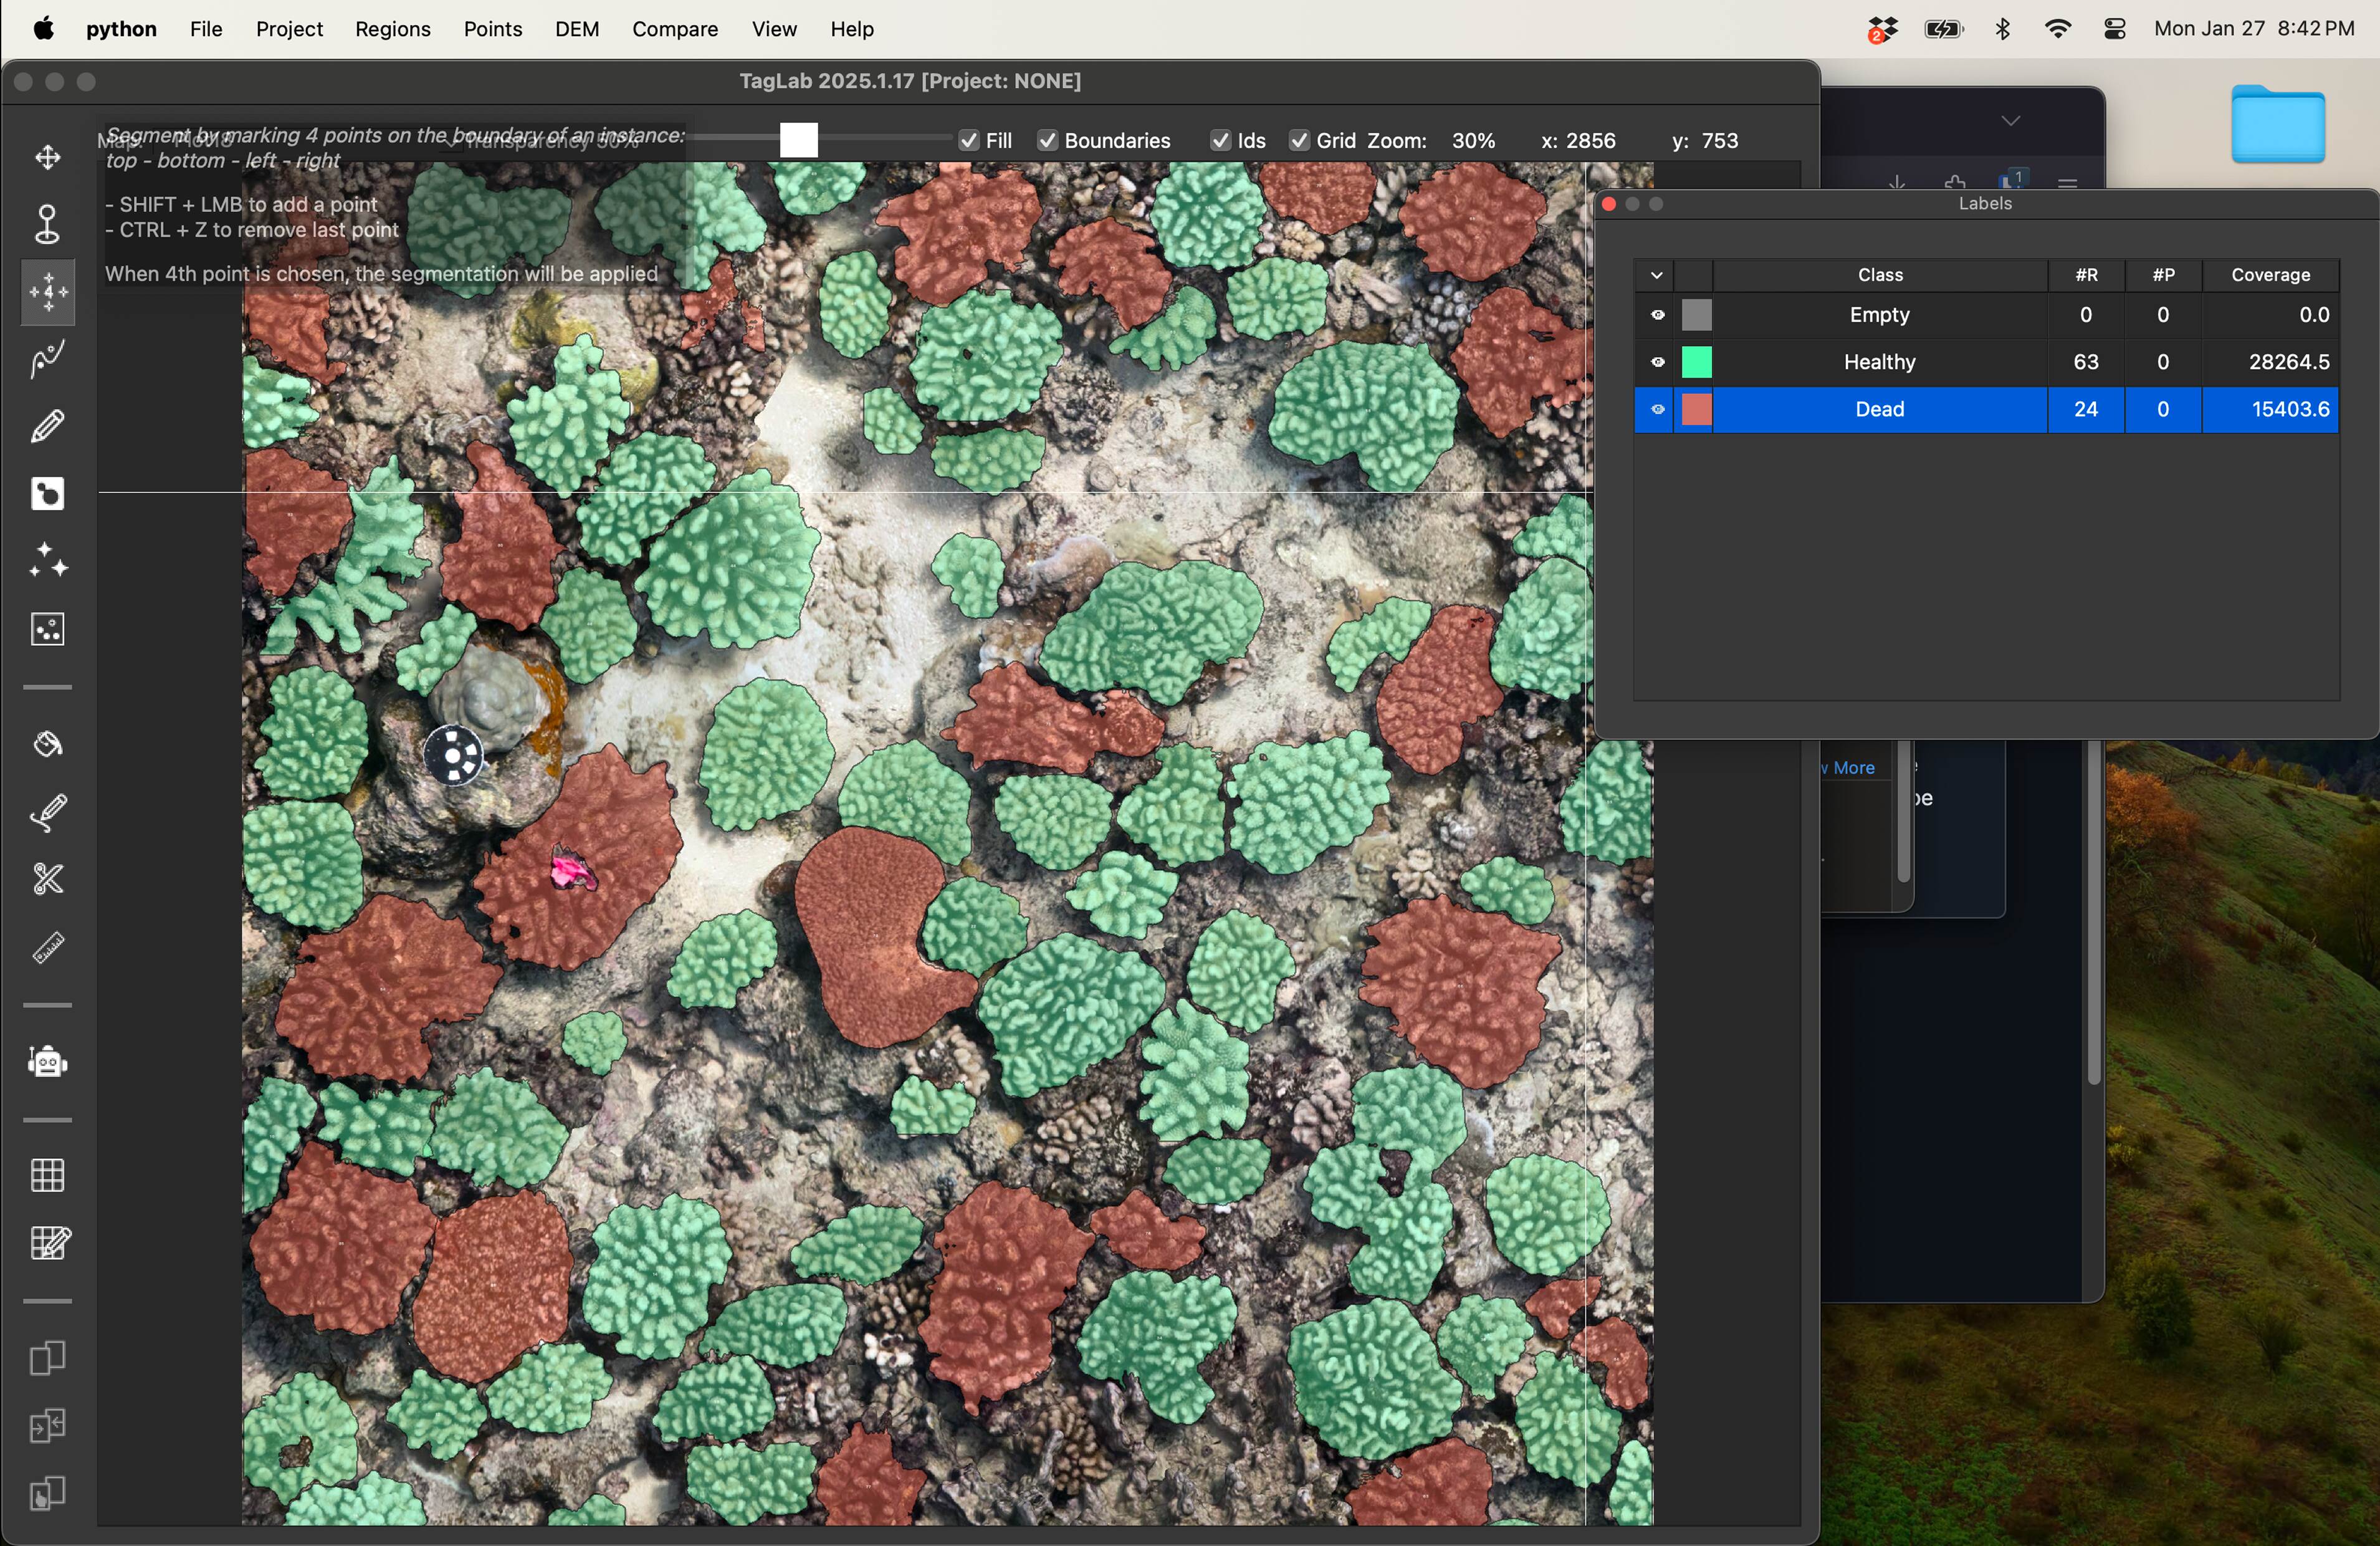
I’ve worked on a range of photogrammetry projects, from creating 3D models of coral reefs to surveying archaeological sites. Photogrammetry is a great way to capture a large amount of data in a short amount of time, and it’s a non-invasive way to survey a site. The data can be used to create detailed 3D models, which can be used for research, education, or public outreach. I’ve developed custom camera rigs and post-processing workflows to optimize the quality and efficiency of the data collection process. I’m currently working on a project to use photogrammetry to monitor the health of coral reefs in the Caribbean.
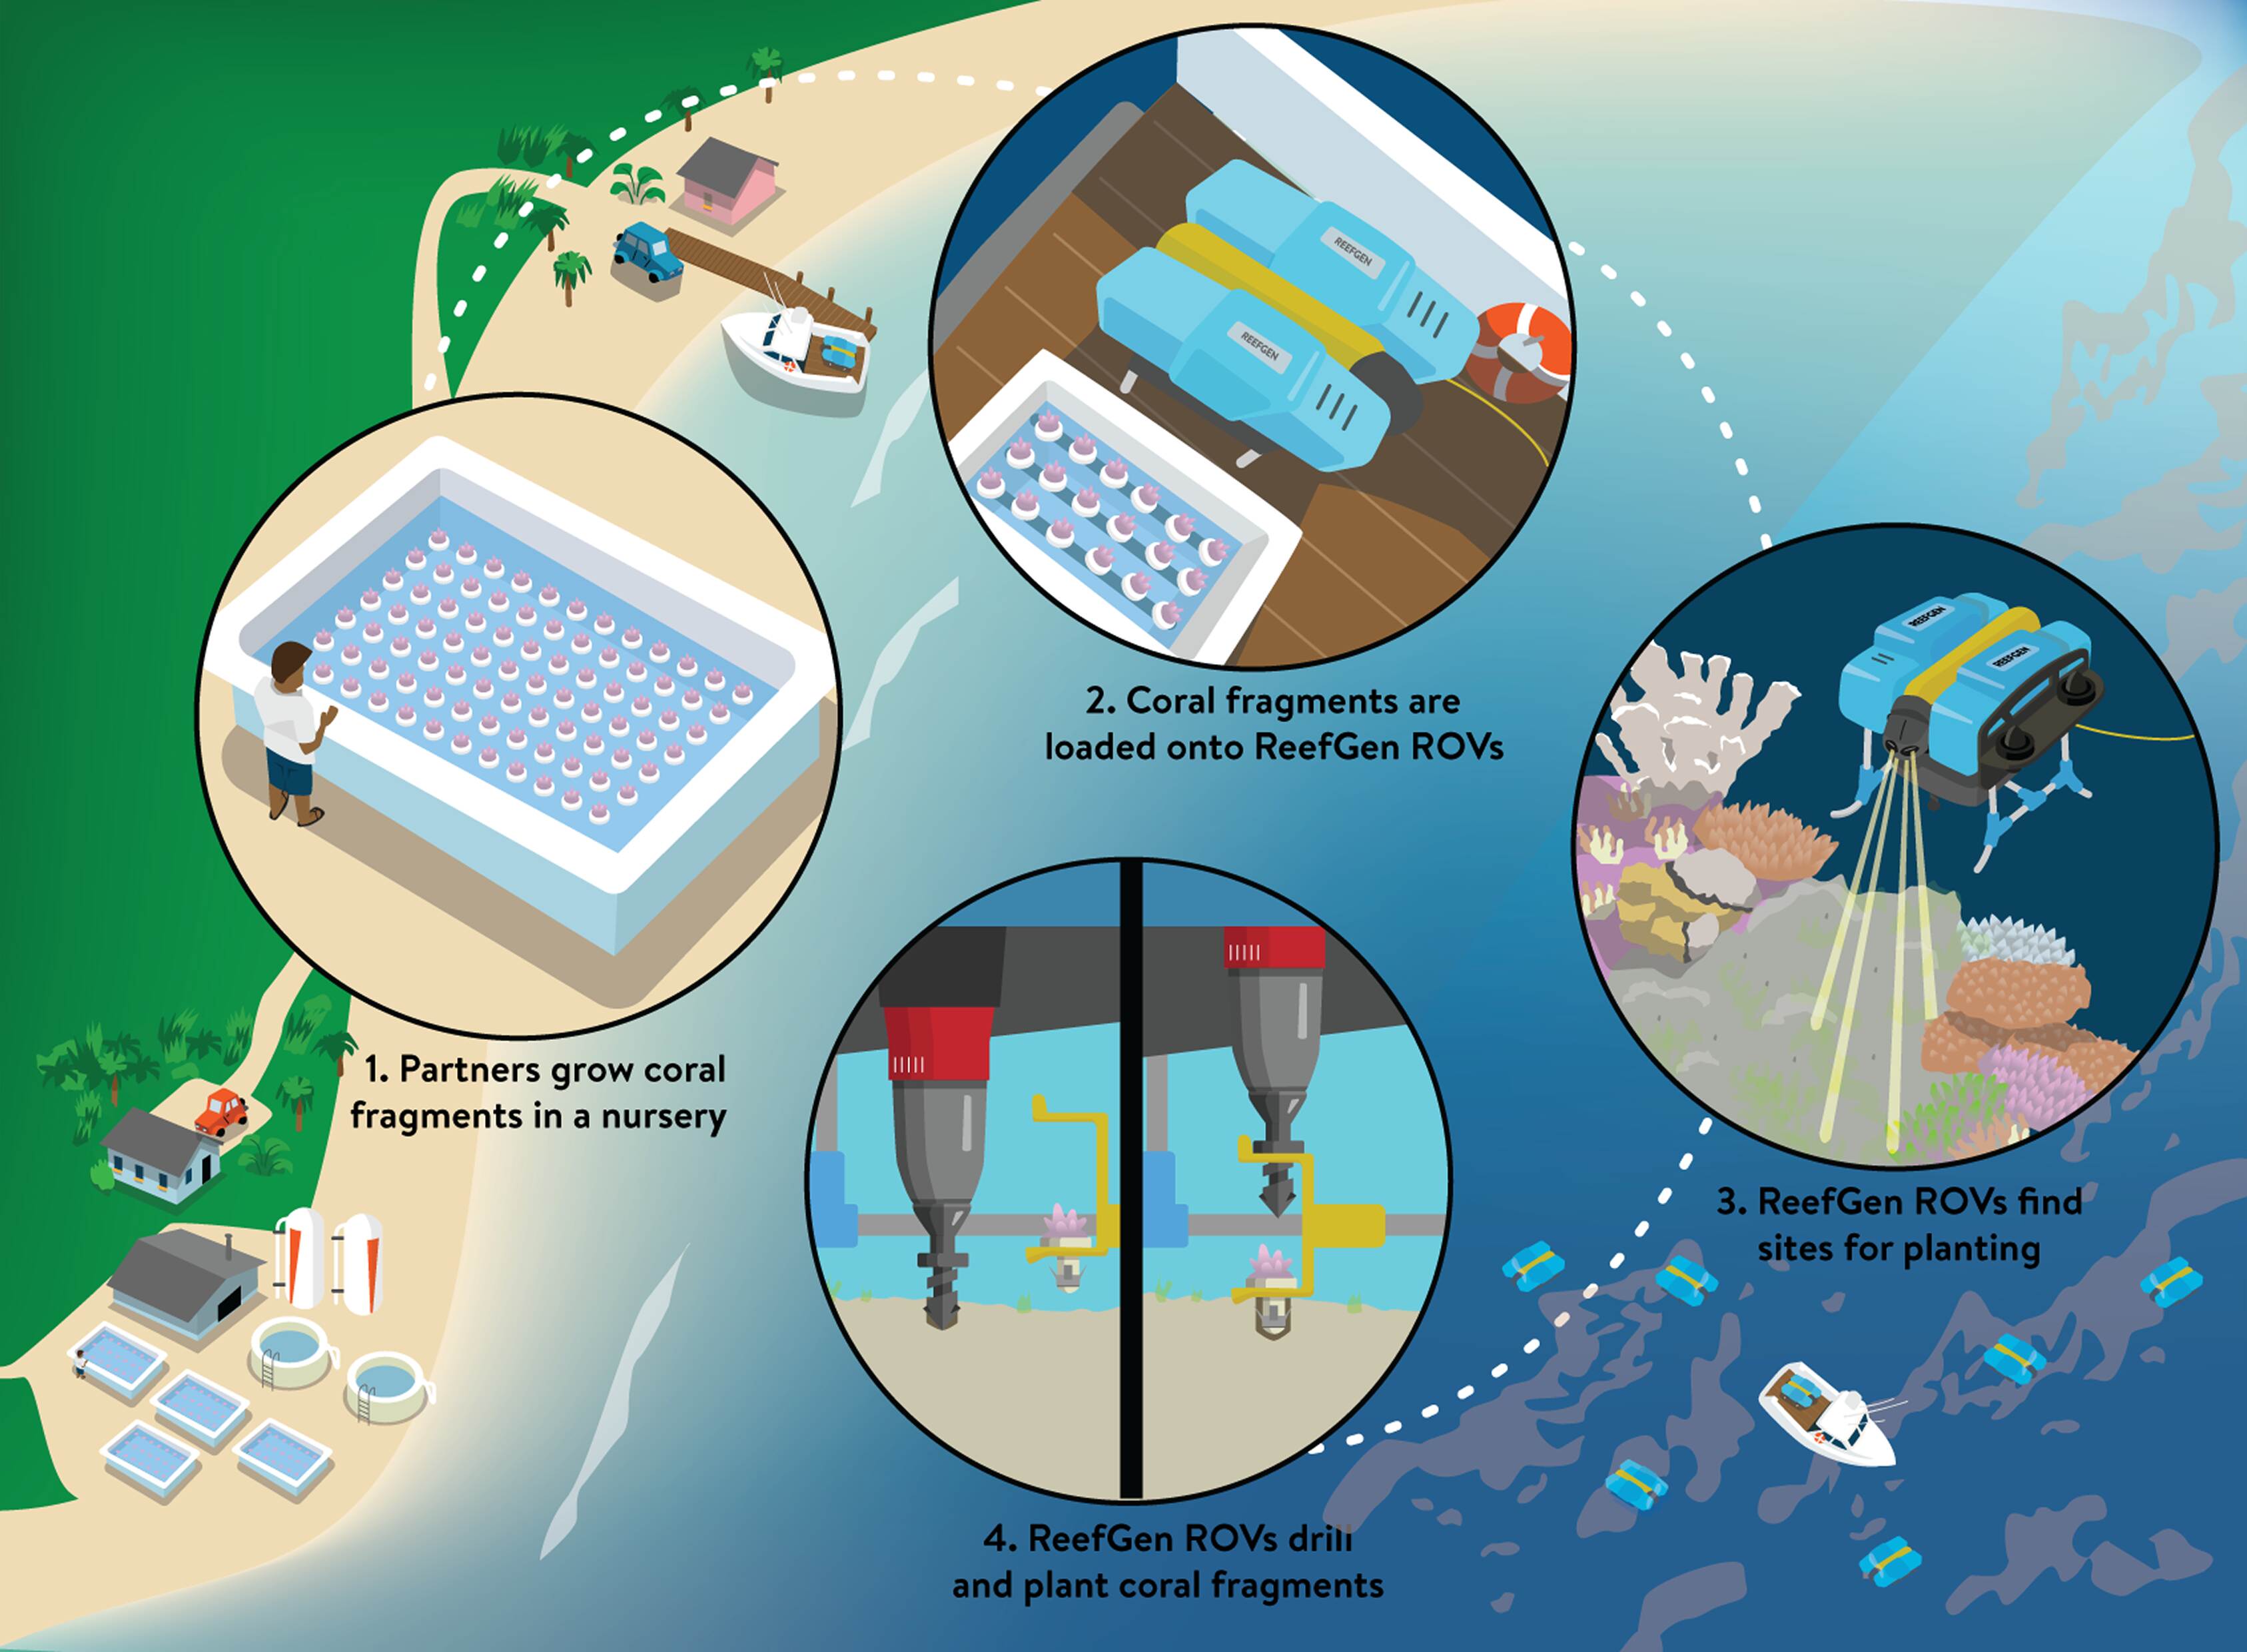
Illustration
I illustrate complex concepts, from biological processes to political issues. The goal is to make the information more accessible and engaging for a wider audience. I’ve worked with researchers and non-profits to create illustrations for grant proposals, academic papers, and public outreach materials. The key to a good illustration is to simplify the story while retaining the accuracy of the science, and to use visual metaphors that resonate with the audience. Researchers often work with illustrations taking in mind the audience they wish to communicate to. This can be other researchers, funders, or the general public. The goal is typically to simplify a story so that the main idea can be communicated quickly which is important in a competitive landscape.