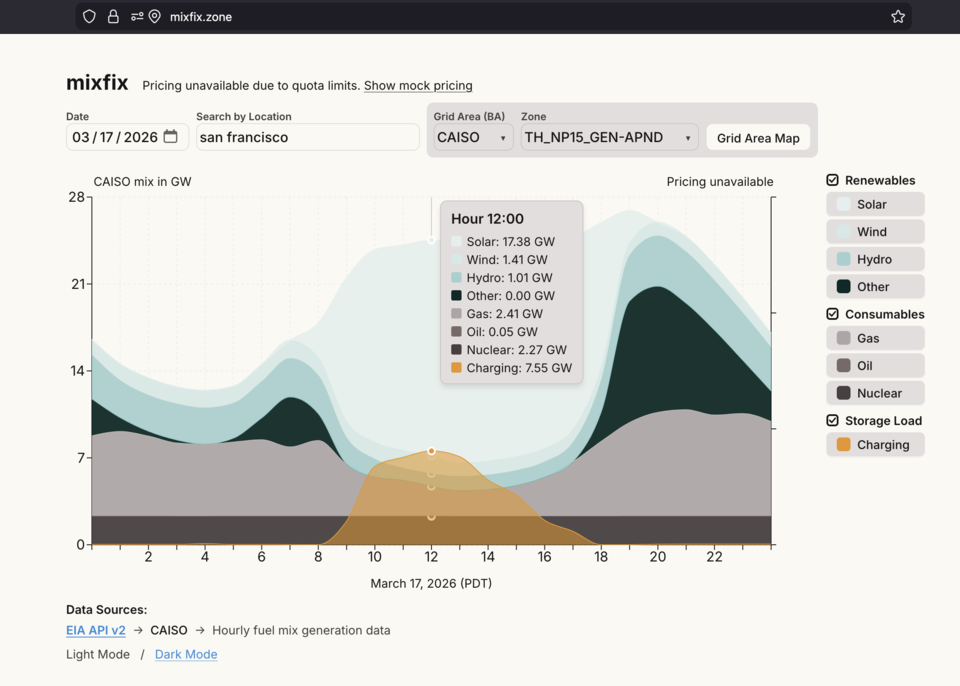
I built Mixfix to compare electricity generation and wholesale prices across place and time. Choose a location and period to explore the selected grid area.
My contribution: Product concept, interaction design, data integration, and AI-assisted application development.
Mapping places to grid areas
A Work on Climate conversation about surplus renewables prompted the idea: use a familiar place and date to explore electricity. Connecting that simple interface to the correct regional data became the central challenge.
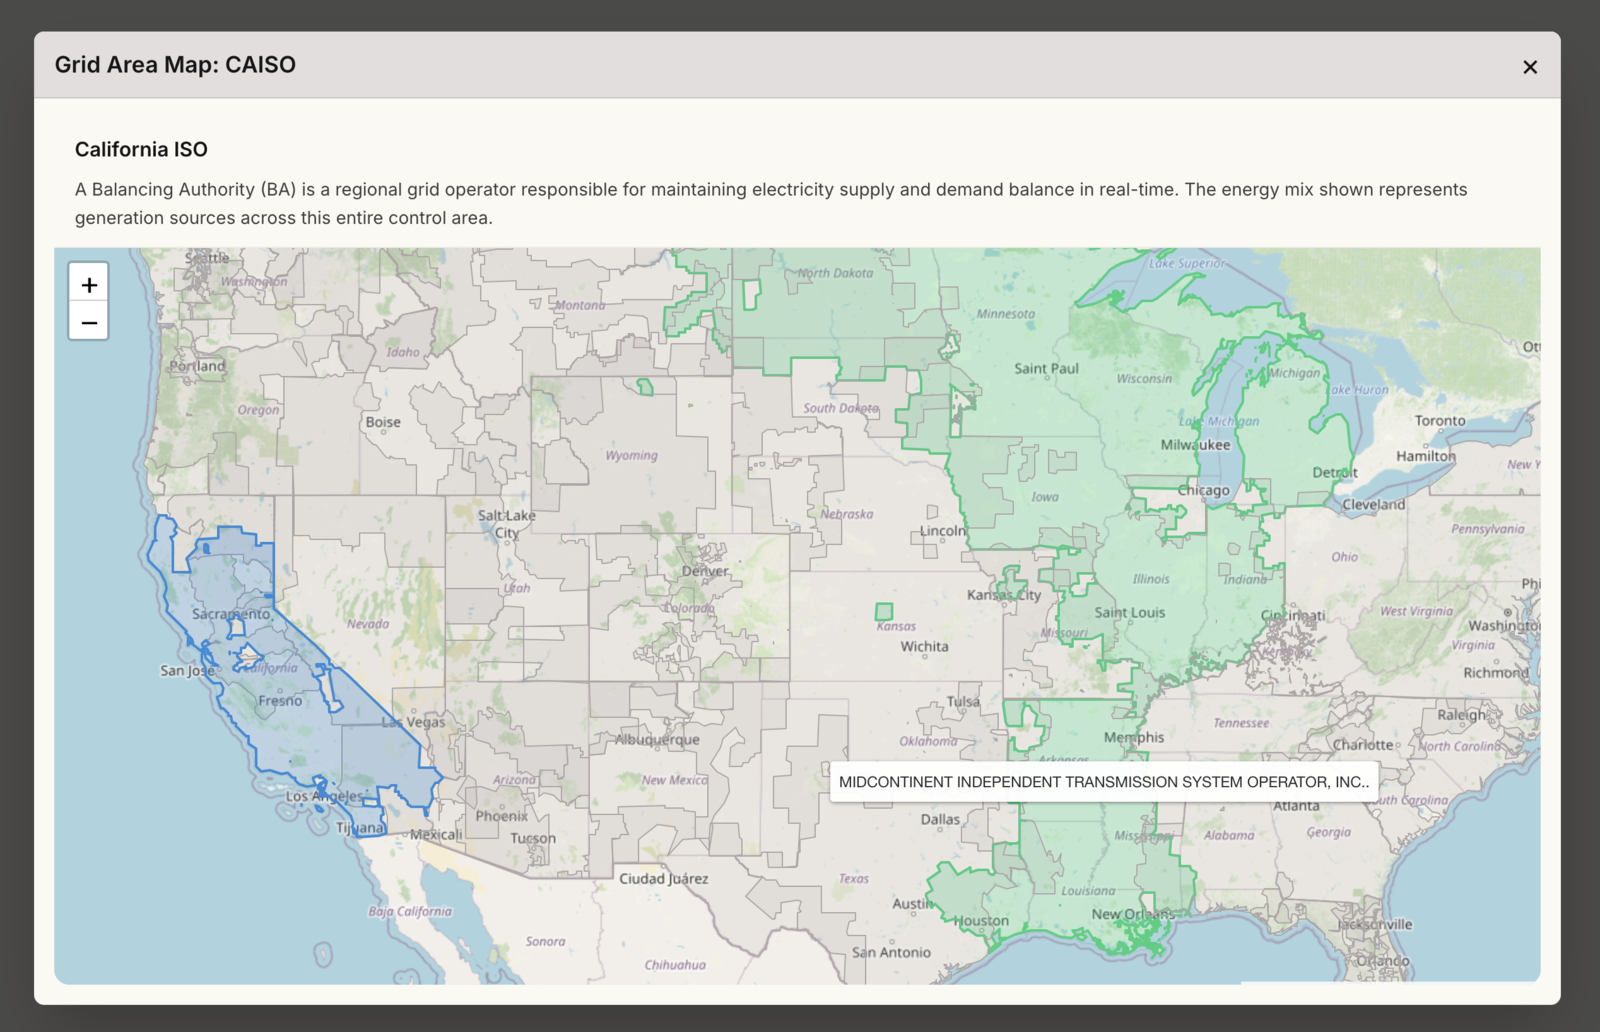
Generation is reported by balancing authority; prices may refer to a smaller market zone. An interactive map lets users inspect and change both.
Mixfix helps people investigate electricity and climate without learning operator codes or APIs. It shows regional generation and wholesale prices, rather than household tariffs or an individual home’s supply.
Different clocks, incomplete records
Sources use different timestamp conventions, and a local day can span two UTC dates. I corrected date windows and timezone handling to follow the selected region.
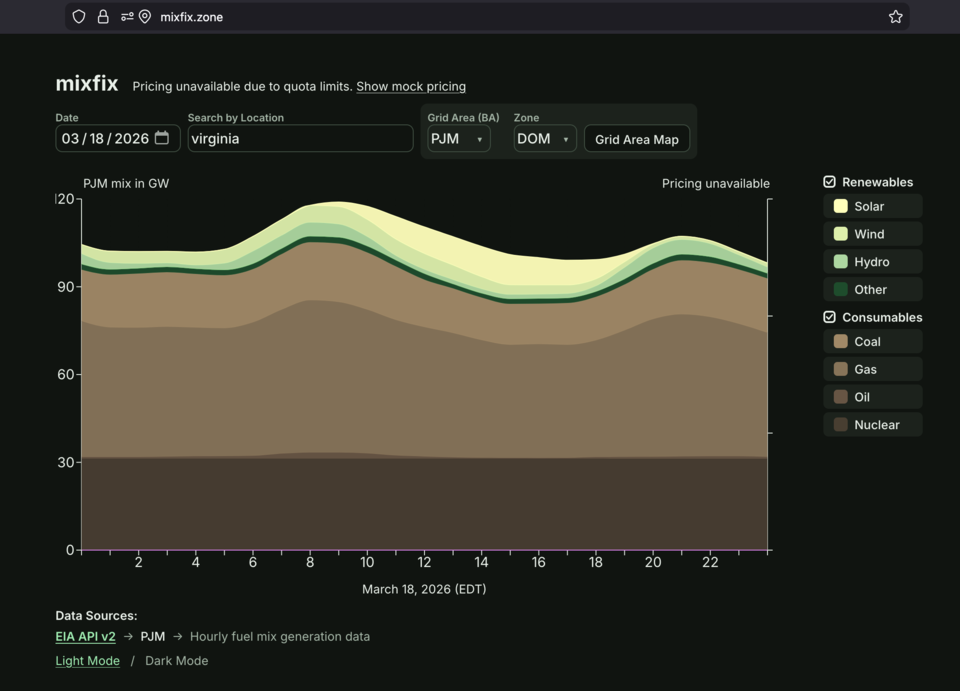
Charts preserve missing data as gaps rather than false drops to zero. Day, month, and year views change the timescale; source labels and unavailable-data messages explain the results. Users can change timescale without losing the selected place.
The US catalogue has 75 EIA respondent entries, including regional aggregations, and pricing configured for seven ISO/RTO markets. Generation and price availability can differ.
Designing a readable comparison
Generation and pricing share a chart but answer different questions. I established consistent colors and grouped controls so users can toggle series while retaining the location and period. Users can compare reported fuel categories and price components while keeping their different meanings clear.
I directed AI-assisted development by reviewing source queries, investigating misleading results, and refining the interface around the data’s meaning and limitations.
How the application works
Mixfix uses Next.js, React, and TypeScript, with Recharts for charts, Leaflet for geography, and SWR for requests tied to the selected place and period.
API routes retrieve EIA generation and Grid Status pricing. Geocoding and control-area geometry locate the region; a shared layer handles time conversion, validation, and in-memory or optional Redis caching.
Location lookup identifies the reporting context; separate energy queries retrieve the period, preserving the distinction between generation regions and pricing zones. Changing a location updates the queries and the geography together.