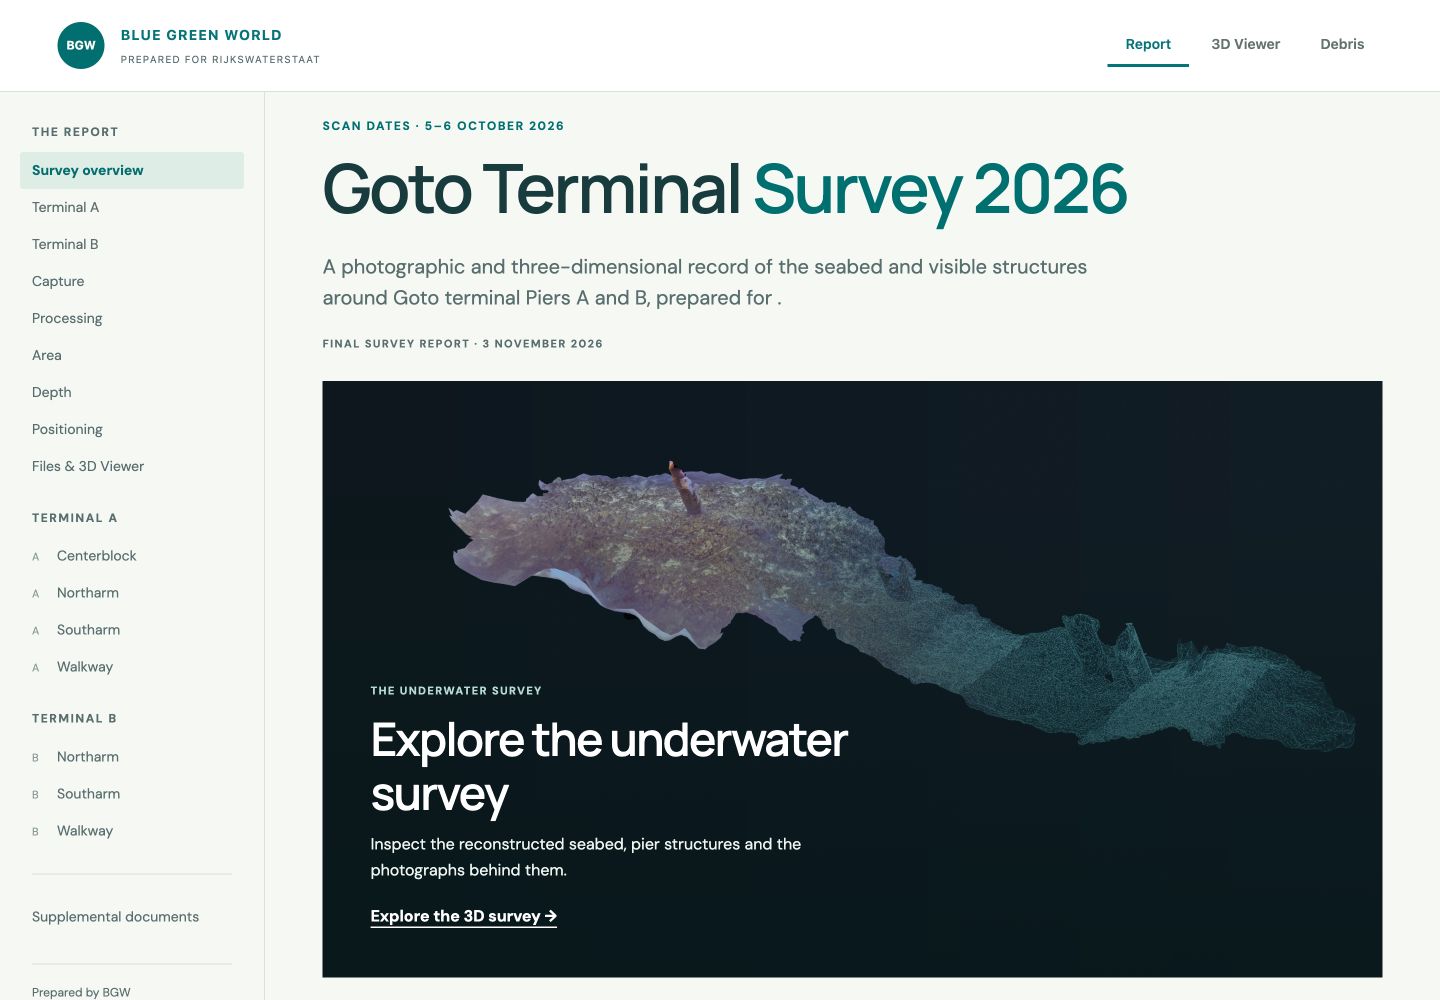
I built this portable browser application for Rijkswaterstaat through Blue Green World. It connects seven reconstructed sections of Bonaire’s Goto terminals with source photographs, measurement tools, saved observations, and the survey report. Survey recipients can move from a terminal overview to the photographic evidence behind an observation.
I handled underwater surveying, imagery preparation, reconstruction, viewer development, and reporting. Jason D. Croop and I surveyed Piers A and B on 5–6 October 2026: seven dives over two days.
The archive contains 35,611 photographs and approximately 14,695 m² of horizontal reconstructed footprint, counting overlap once within each terminal. Reviewers can inspect it without the original photogrammetry software.
A report built for inspection
The report establishes what was surveyed and how it was processed. Its overview leads to terminals, scan sections, methods, coverage, depth references, positioning, and handover files.
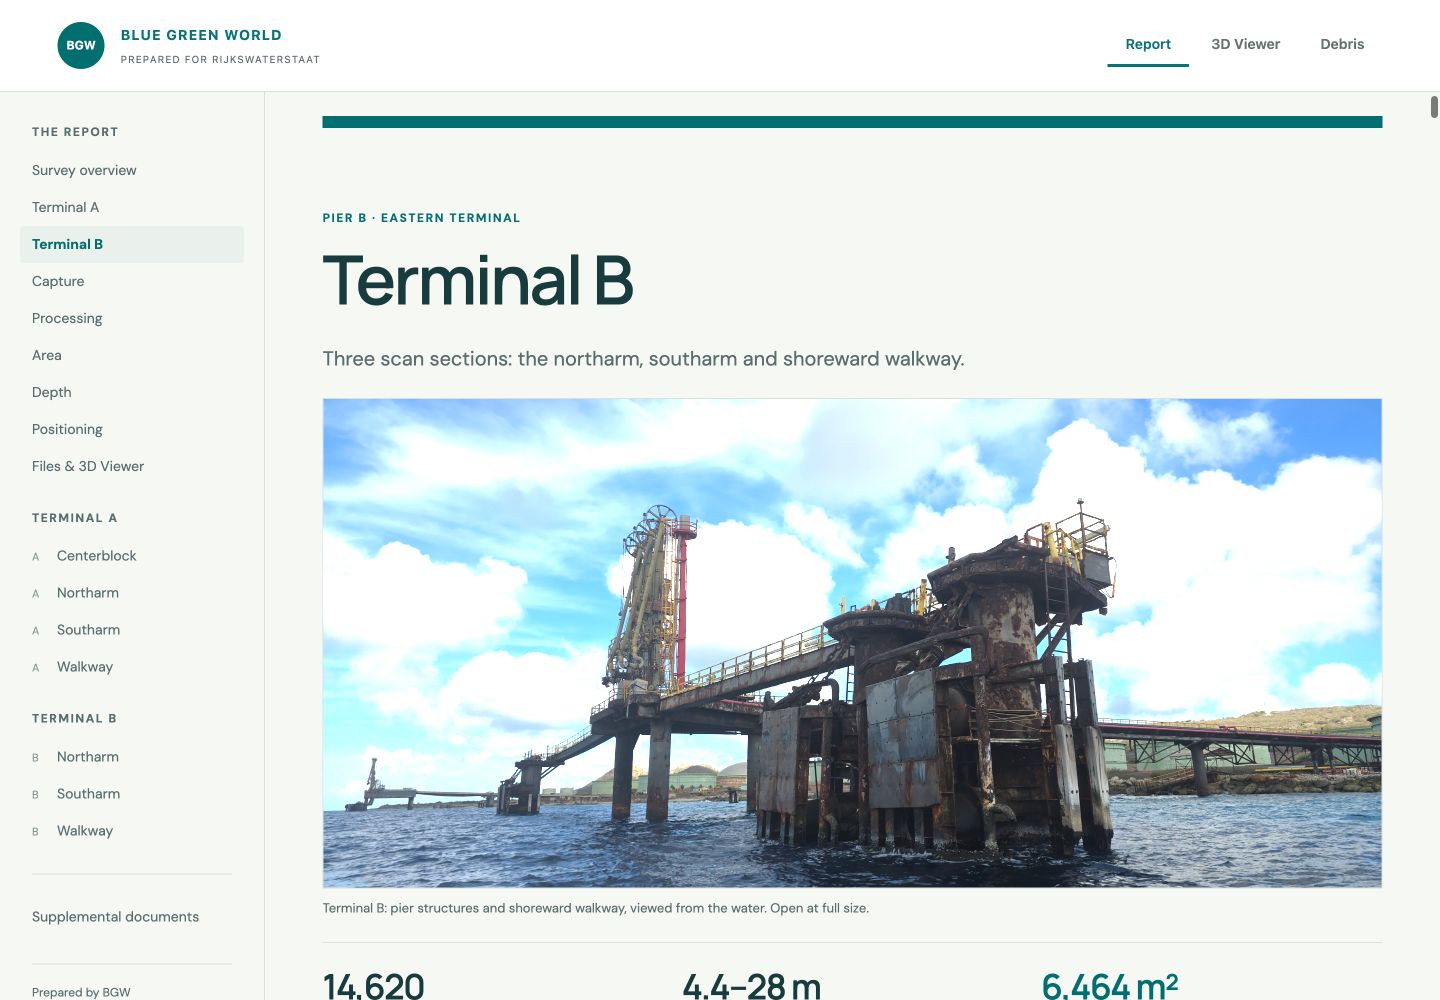
Each illustrated scan record pairs the model with photograph counts, reconstruction settings, reference depths, and footprint measurements, giving reviewers a route into the evidence.
A route from the model to the photographs
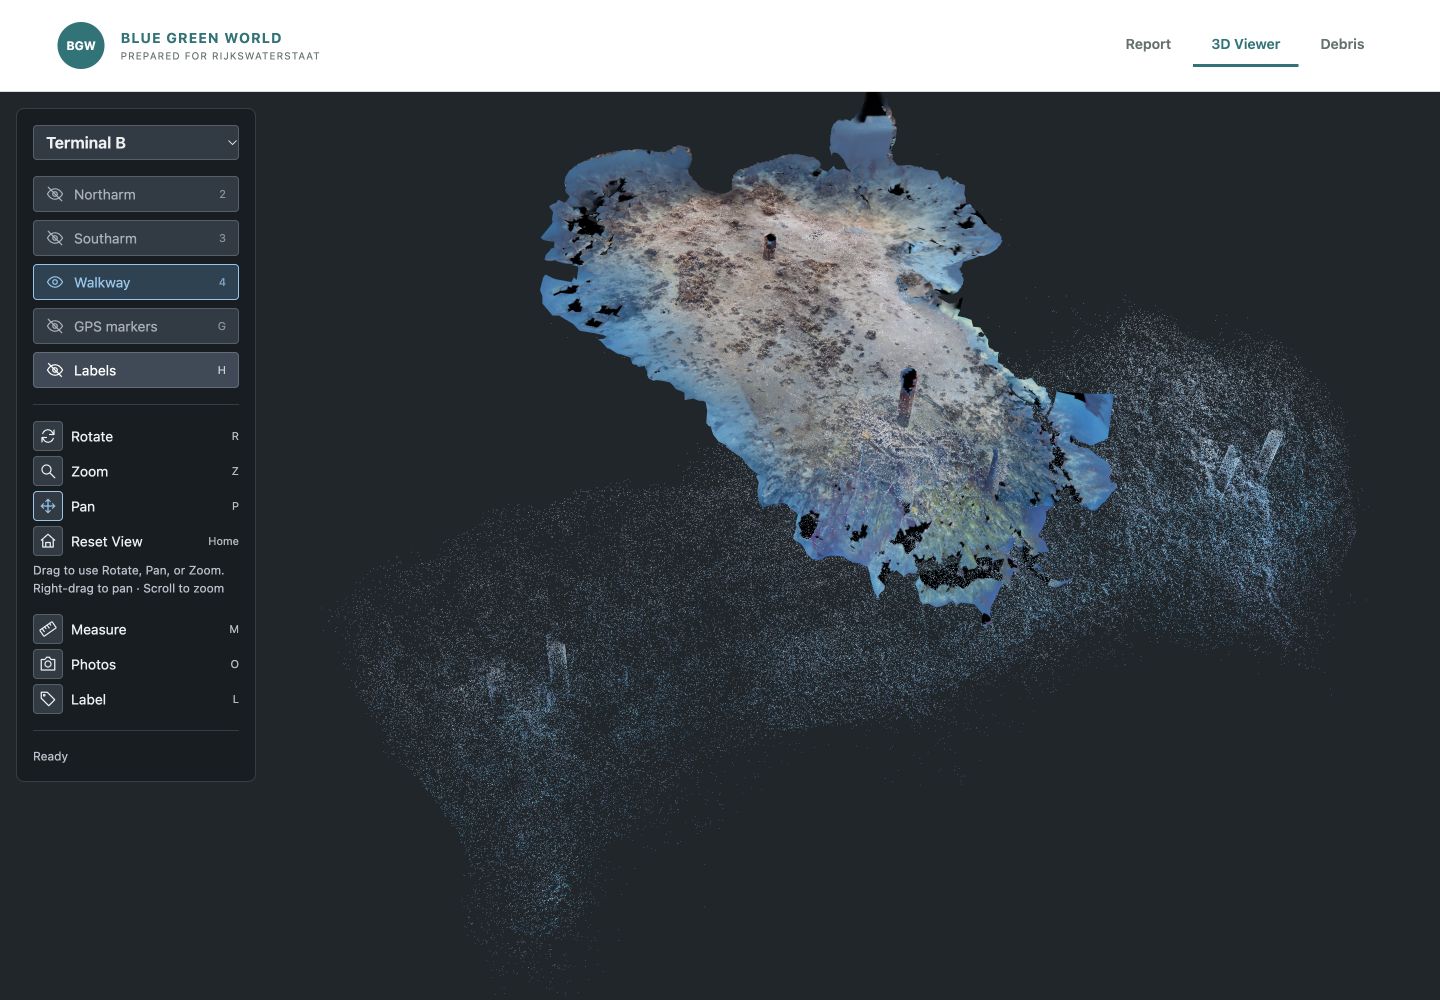
Reviewers can switch terminals, toggle scan sections, and pan, orbit, or zoom to locate an observation.
Selecting a model surface uses camera calibration and positions to find photographs covering that point. Each source image marks the selected location, connecting the reconstruction to its photographic record.
An observation is a place you can return to
A saved label retains the model position, active scans, camera position, and view target. Selecting it returns another reviewer to the same location and view.
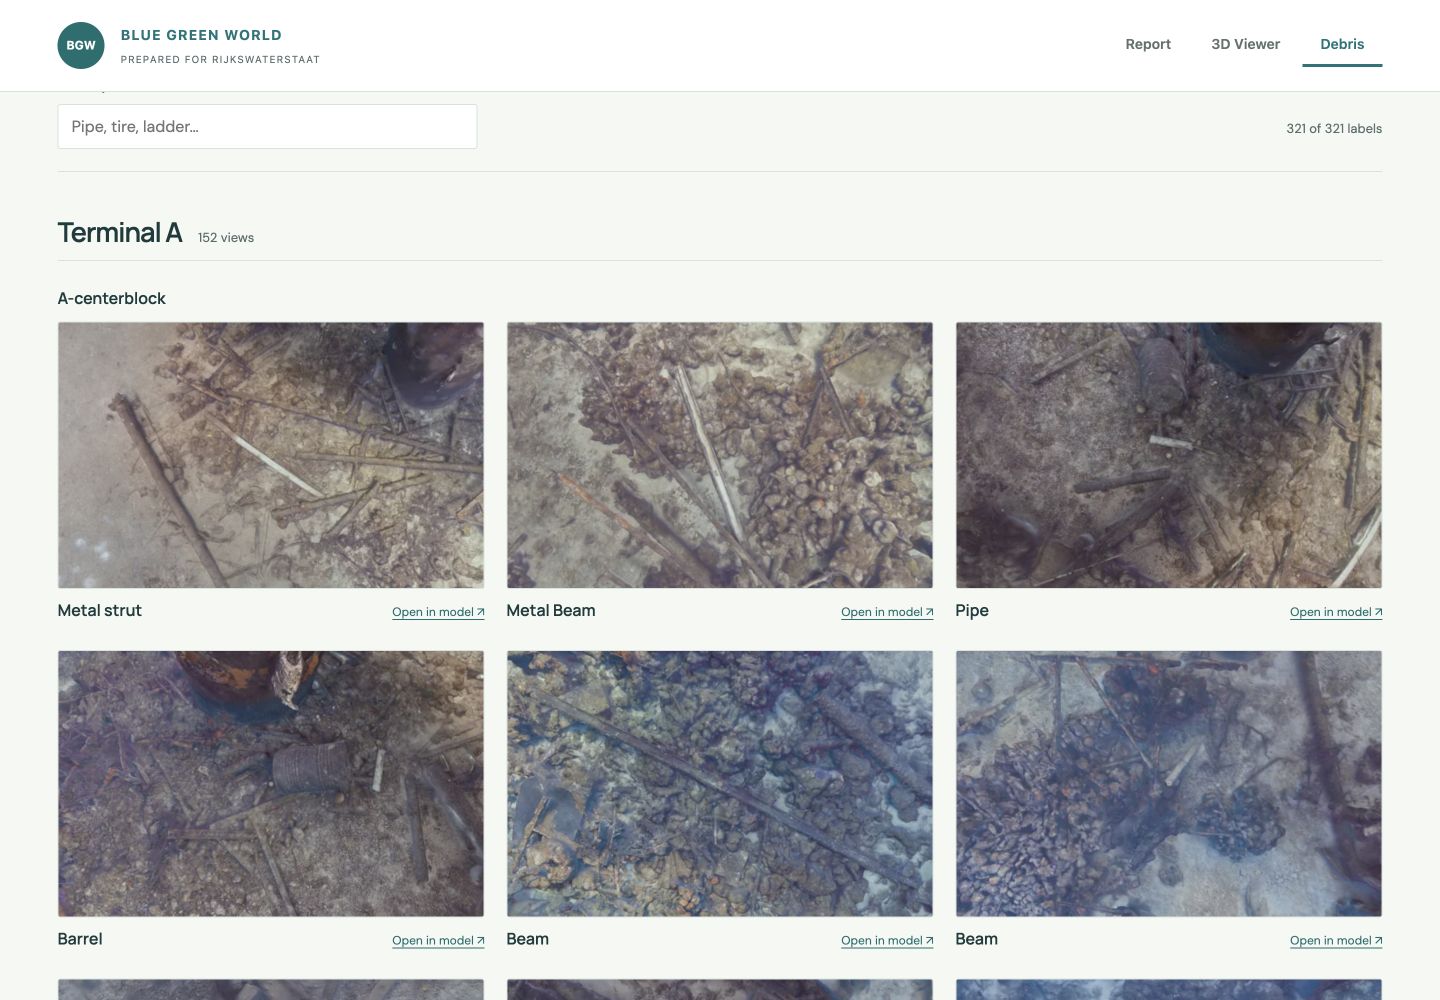
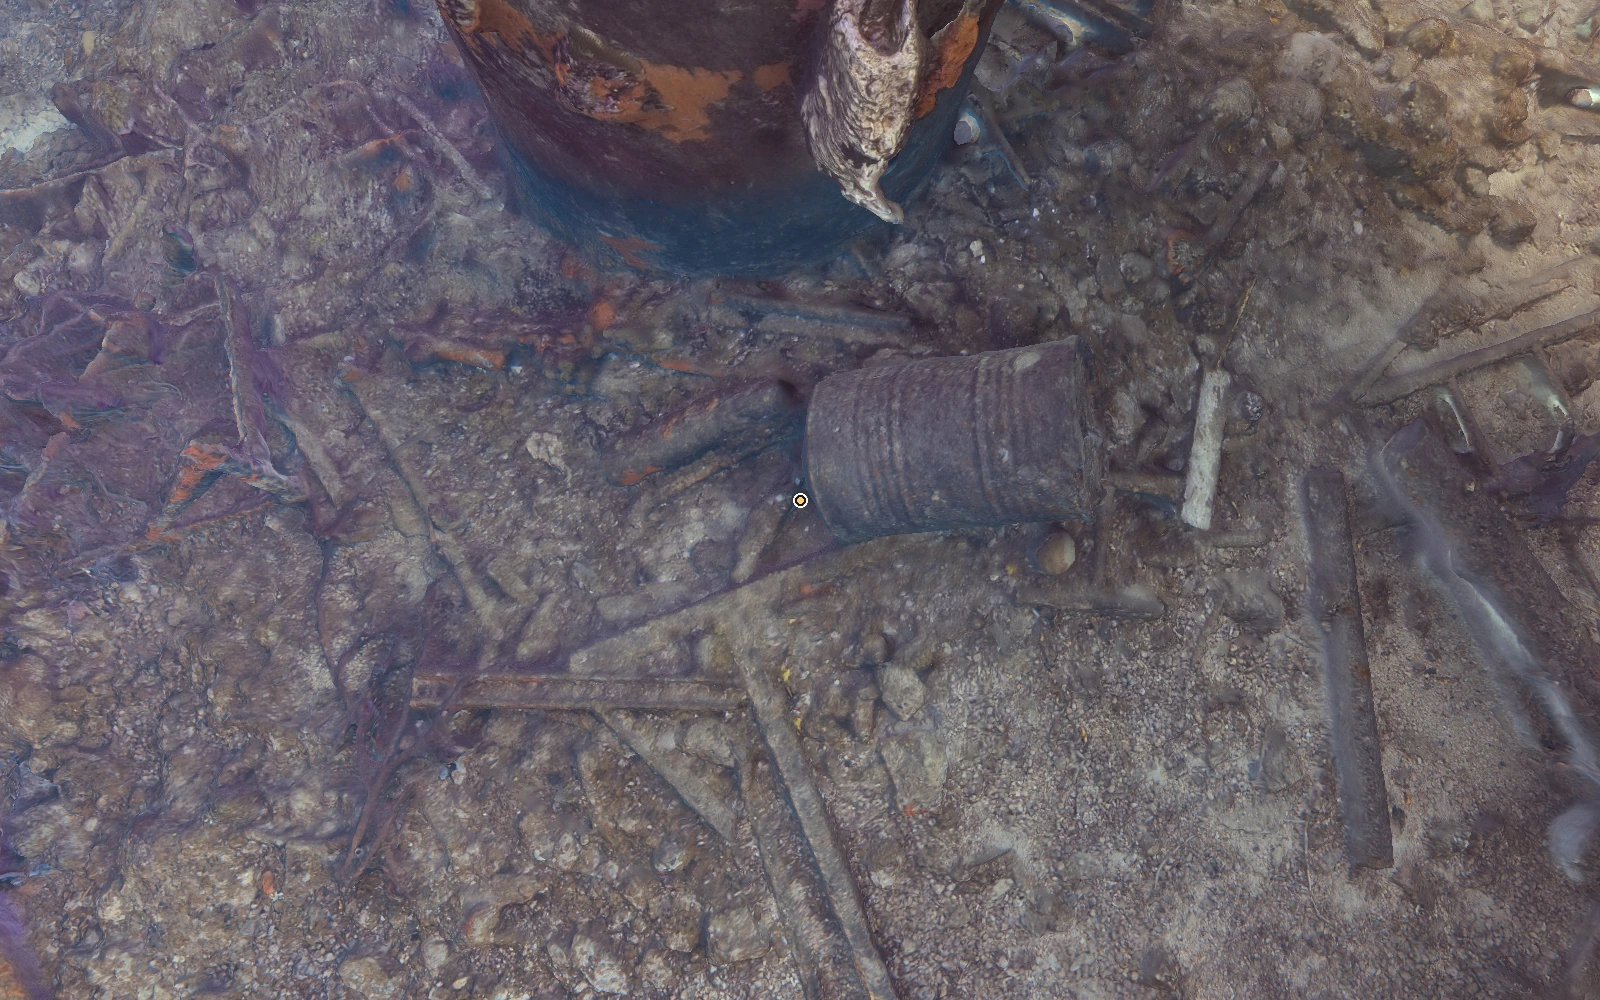
The debris gallery links saved views back to the model. Manually recorded labels identify barrels, beams, pipes, grates, and other points of interest.
Coverage is part of the explanation
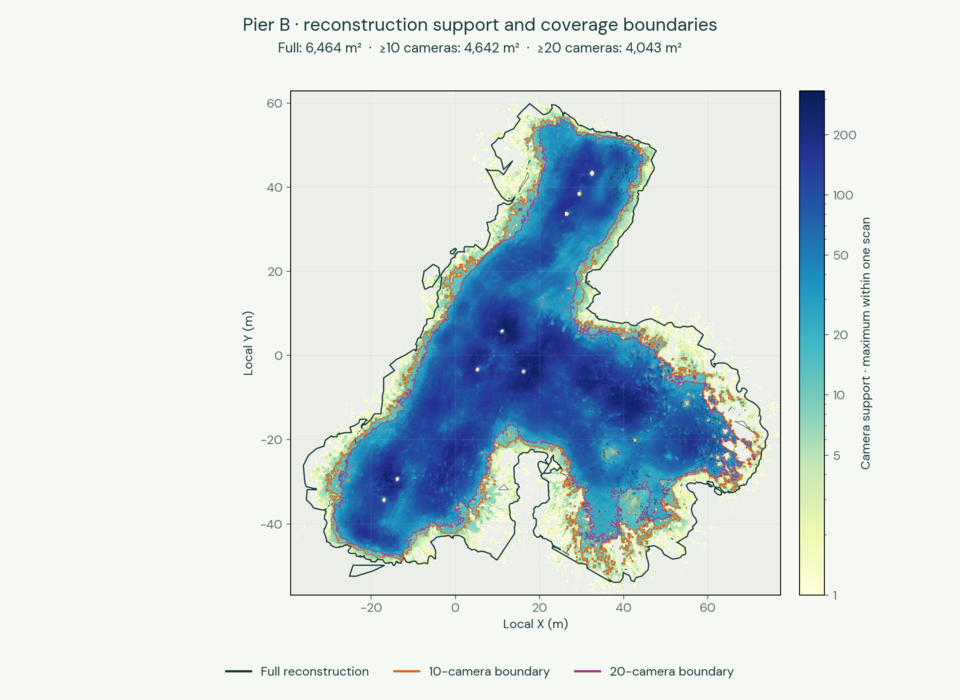
Area totals do not show how evenly a site was photographed. The report compares the full footprint with areas supported by at least 10 or 20 cameras, identifying stronger photographic coverage. These boundaries distinguish the reconstructed extent from areas with stronger photographic support.
Coverage maps retain holes and fragments and count overlap once per terminal. Structures, shadows, water conditions, and access constrained capture. Camera support describes available observations, rather than measuring accuracy.
Depth and field references
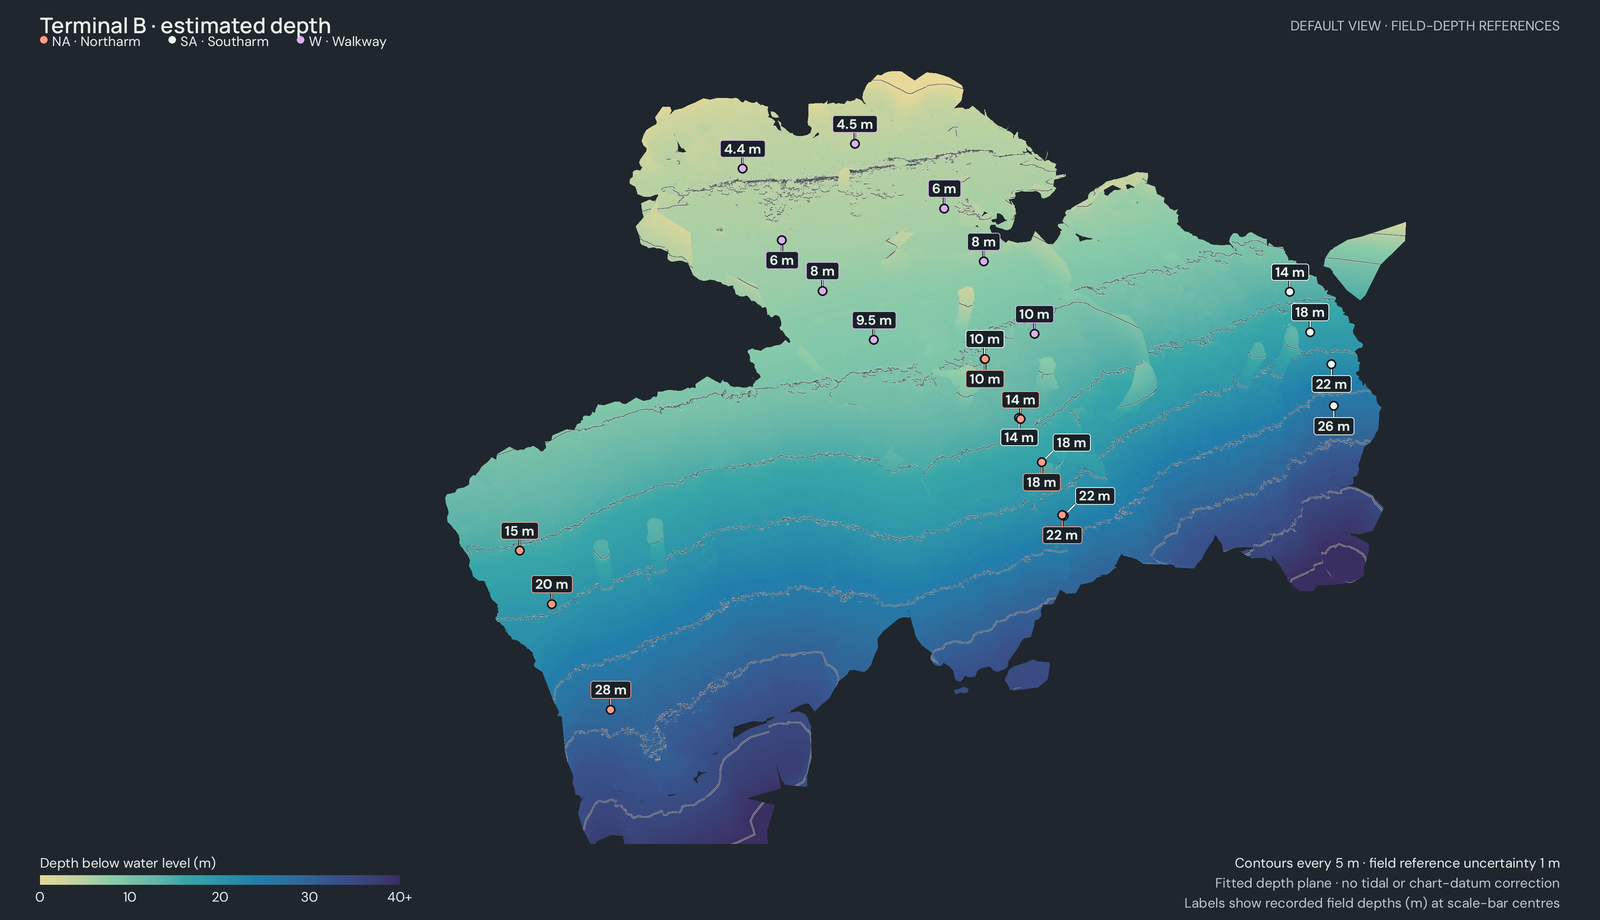
Model-derived depths appear alongside field depths recorded at scale-bar centres, helping reviewers interpret the vertical structure and its reference measurements. These references also explain the limits of the depth measurements available for interpreting the model.
A survey application that travels with its data
The survey archive includes the application and runtime for offline inspection. Recipients make the delivery folder available offline, then open a launcher to use the report, viewer, and debris gallery without installing Node.js. The report, 3D viewer, and gallery run in a browser with no connection to an online application required.
Three.js and a 3D Tiles renderer display the scene. A local Node.js server streams model tiles and photo thumbnails from indexed archives, avoiding full extraction or loading of entire datasets.
Camera metadata links models to source JPGs. Separate JSON files preserve labelled positions and views for report links, giving recipients an overview, photographic evidence, and observations they can revisit.
Explore the Goto Terminal field survey · All projects · Discuss a project