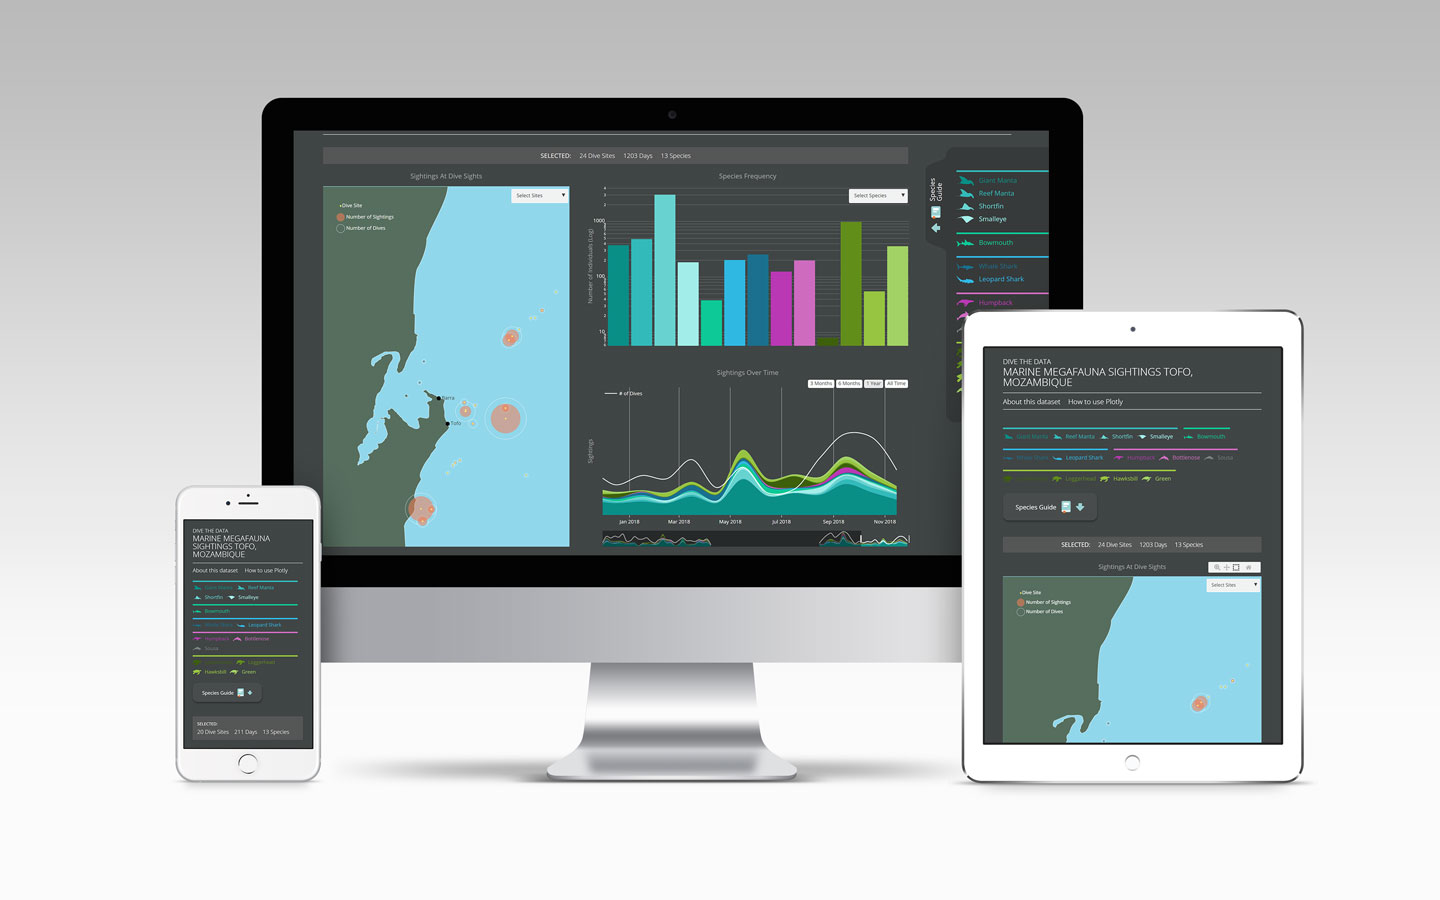
I co-founded and designed Dive the Data, a citizen science platform for recording and exploring marine megafauna sightings. With the Marine Megafauna Foundation and developer Zouhair, I connected dashboard design, field research, and dive-center training.
The project began in Tofo, Mozambique, where dive centers recorded whale sharks, manta rays, and humpback whales. We wanted those records to serve researchers and the teams collecting them.
Started: 2018 pilot.
My contribution: co-founding, platform and dashboard design, field research, and training dive-center teams.
Three views of the same sightings
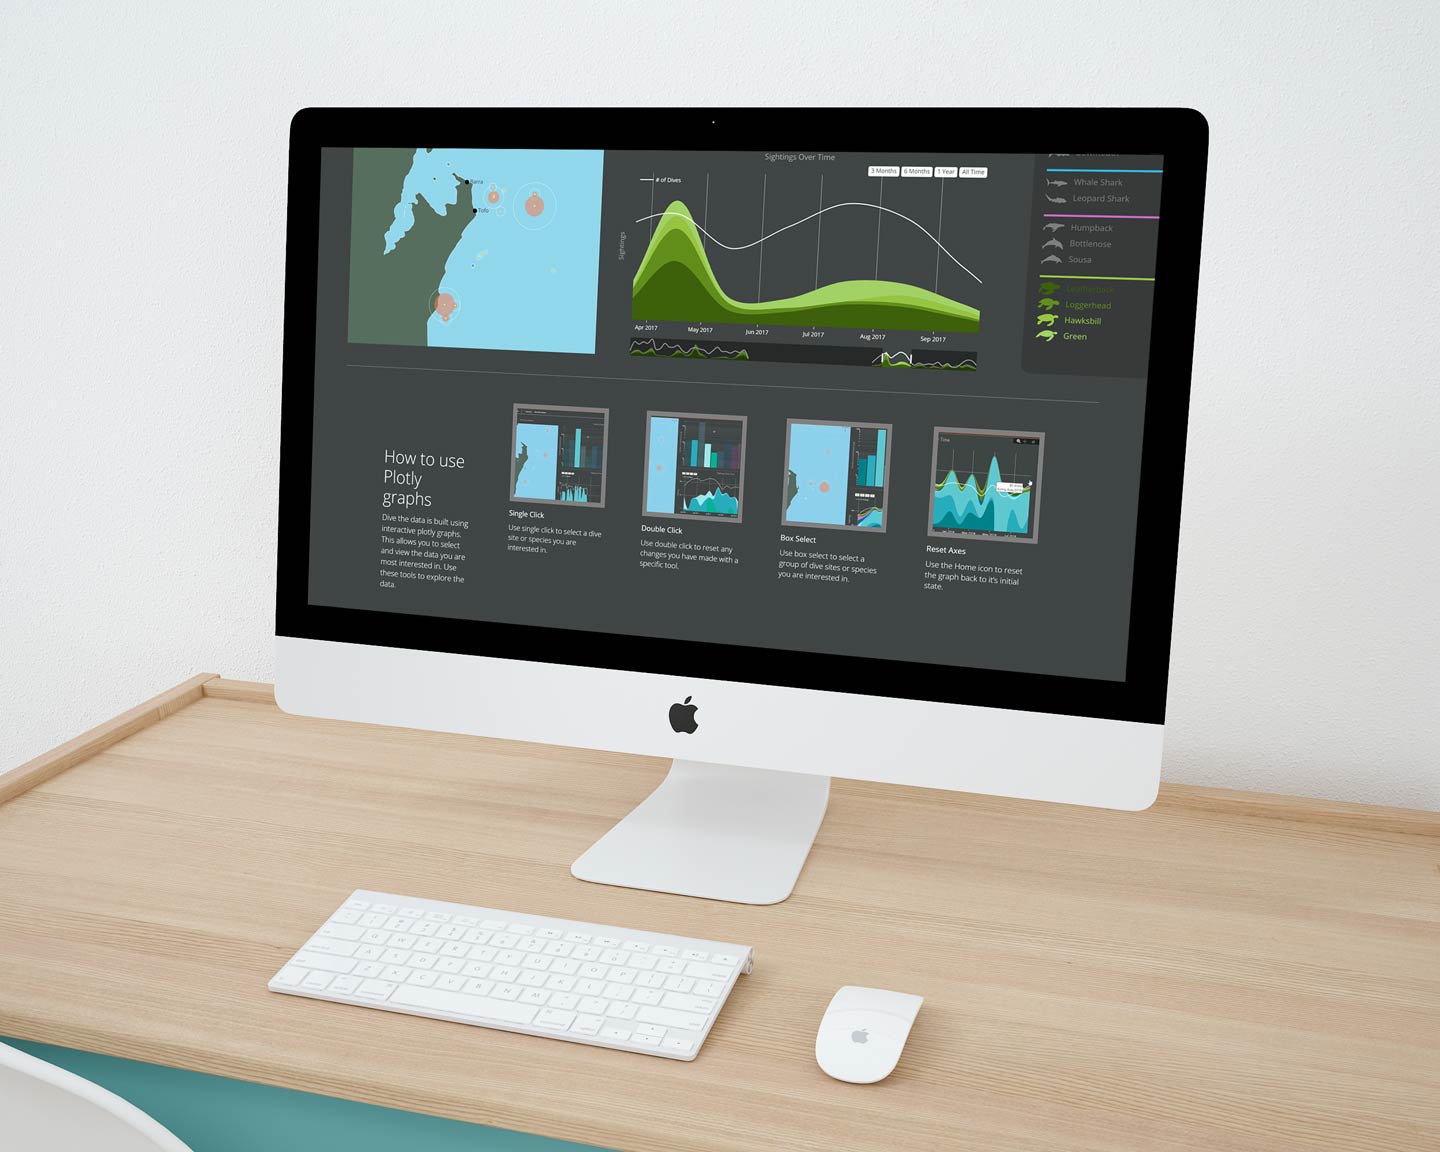
A dive-site map, species-frequency chart, and time chart filter one another. Users can start with a place, animal, or period and follow that selection across the data.
Dive centers can explore where species appear and how sightings change over time. Showing dive counts alongside sightings keeps observations connected to the activity that produced them.
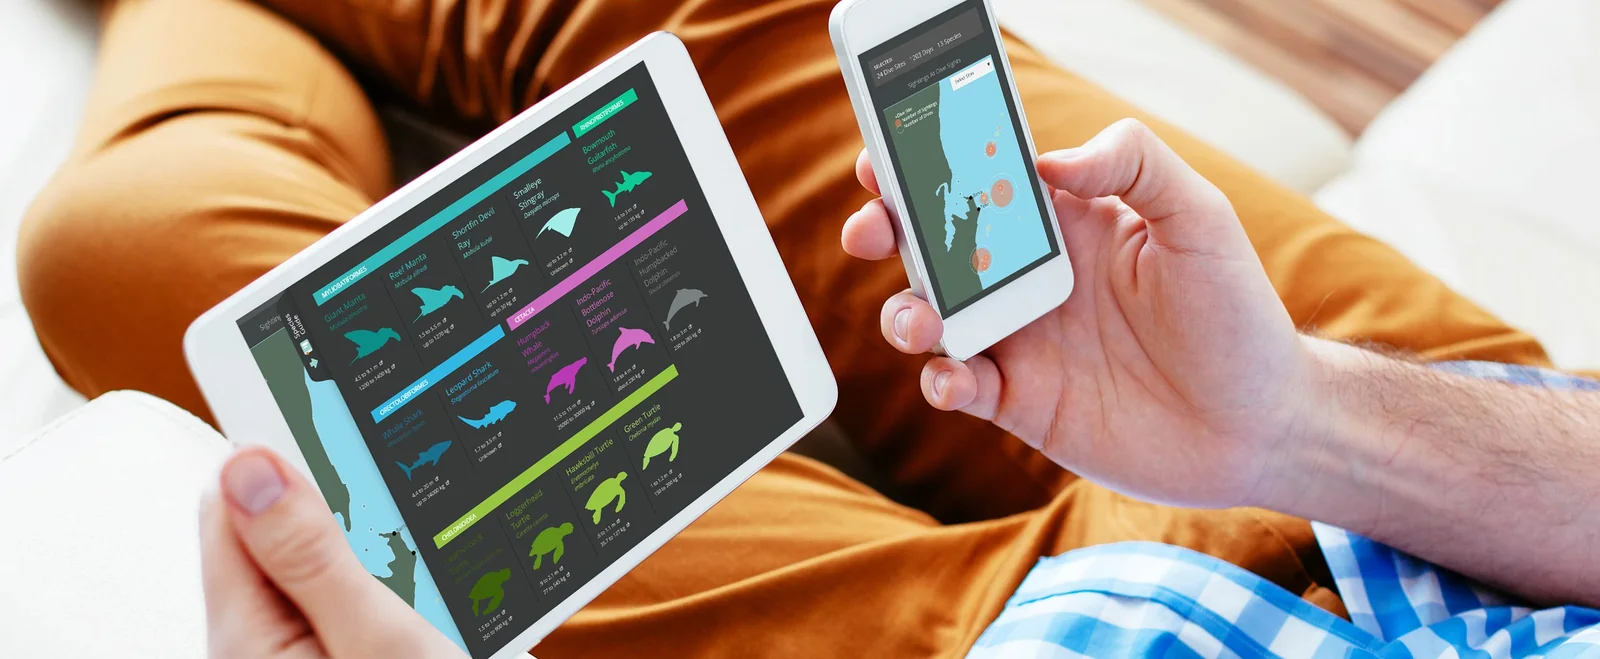
I explored desktop, tablet, and phone layouts for the maps, charts, and species information.
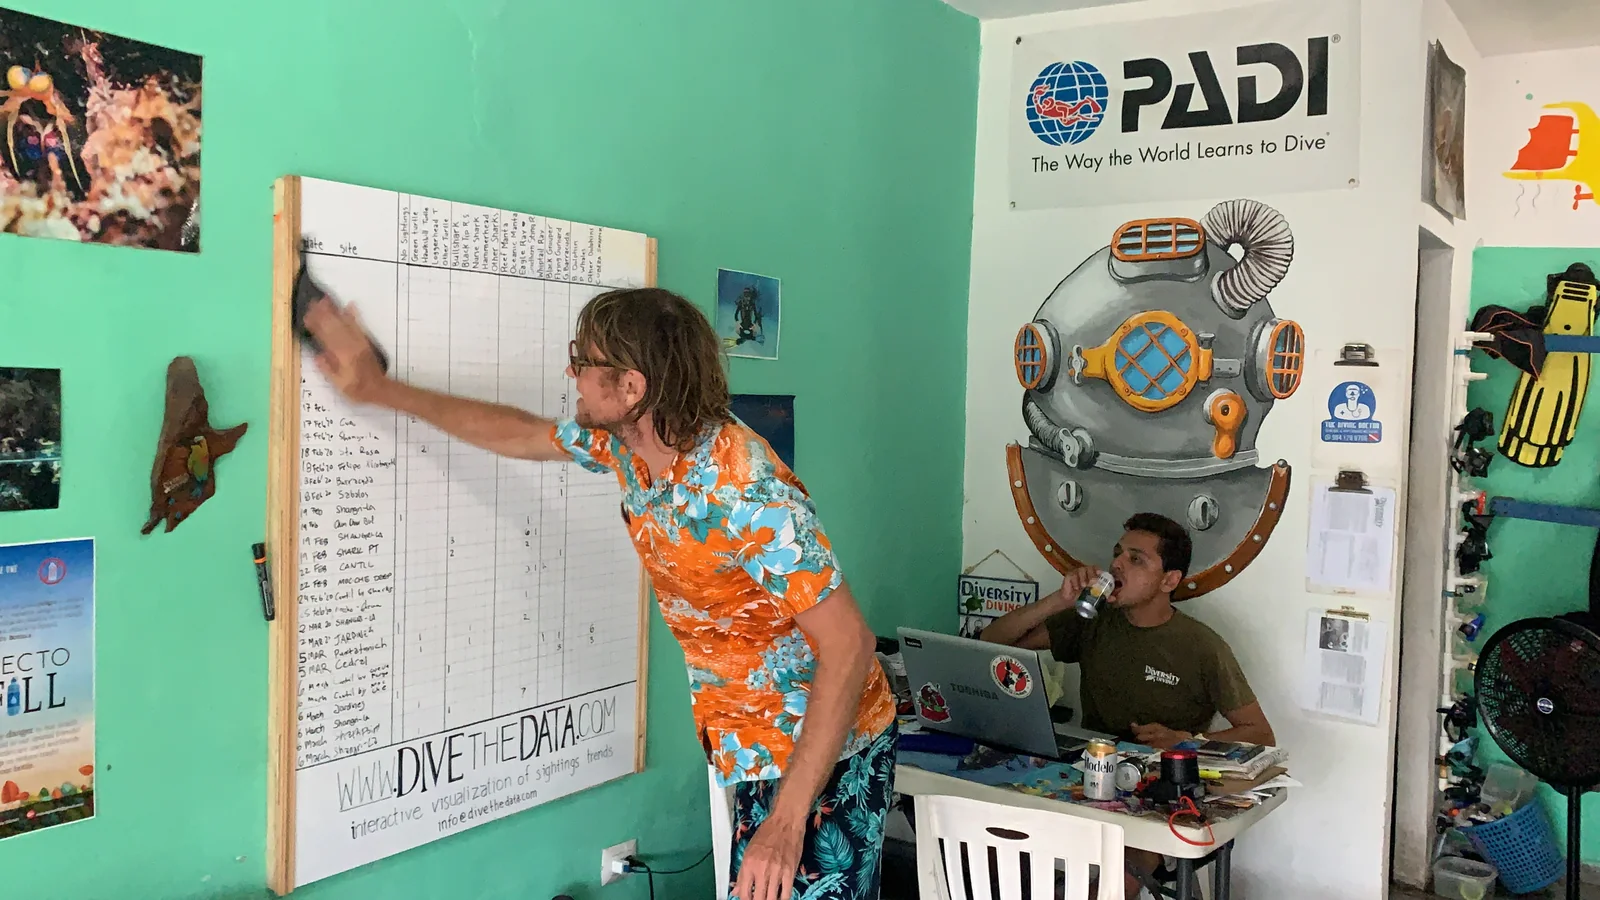
A whiteboard was part of the product
Divemasters told us the collection method made recording sightings difficult. Together, we developed a simpler approach using a whiteboard and phone camera.
Teams recorded sightings on the board during post-dive debriefs. A photograph of the completed board went to an MMF research assistant for transcription and collation. Keeping it at the debrief made recording observations part of the dive-center routine.
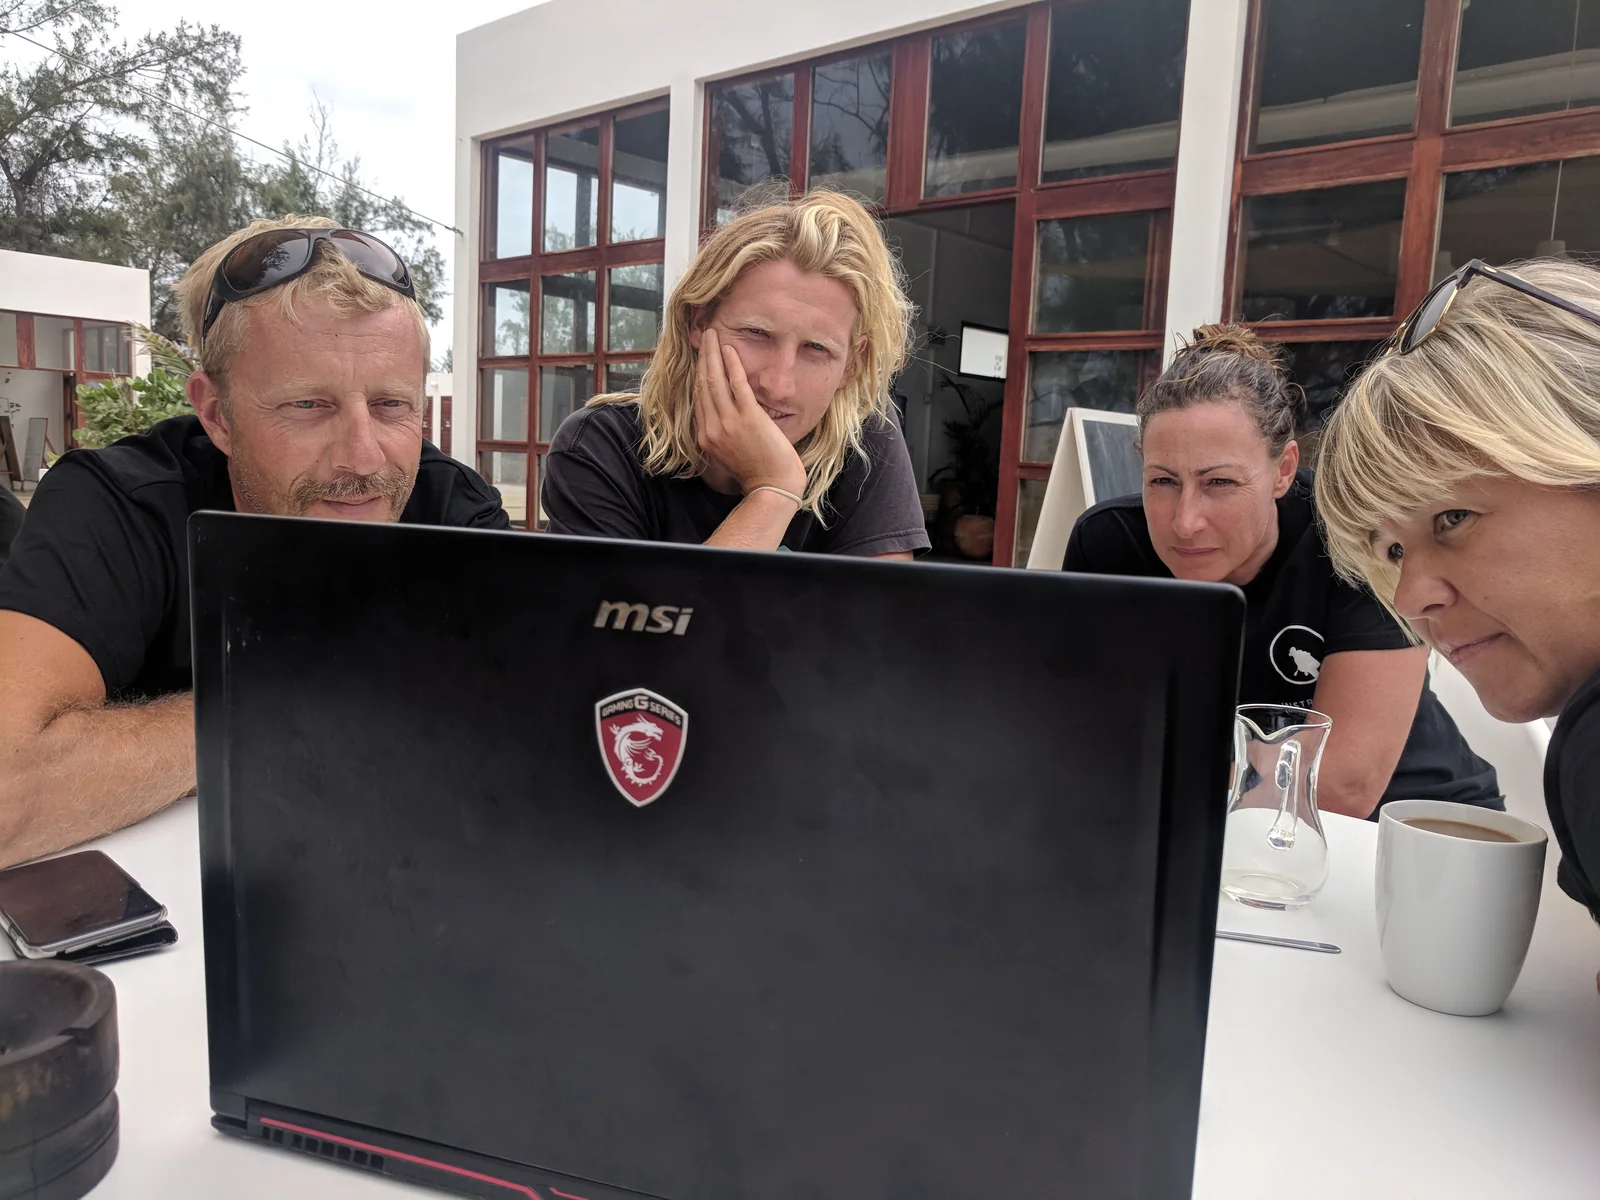
Training covered recording sightings and interpreting the results. Clear visualizations gave contributors a way to explore their work and share it with divers. Returning useful results to the people collecting data was as much a part of the product as the dashboard.
Making rich interactions learnable
Testing showed that divers unfamiliar with interactive graphs struggled with Plotly’s default controls. The charts offered rich control, but that control mattered only if participants understood how to use it.
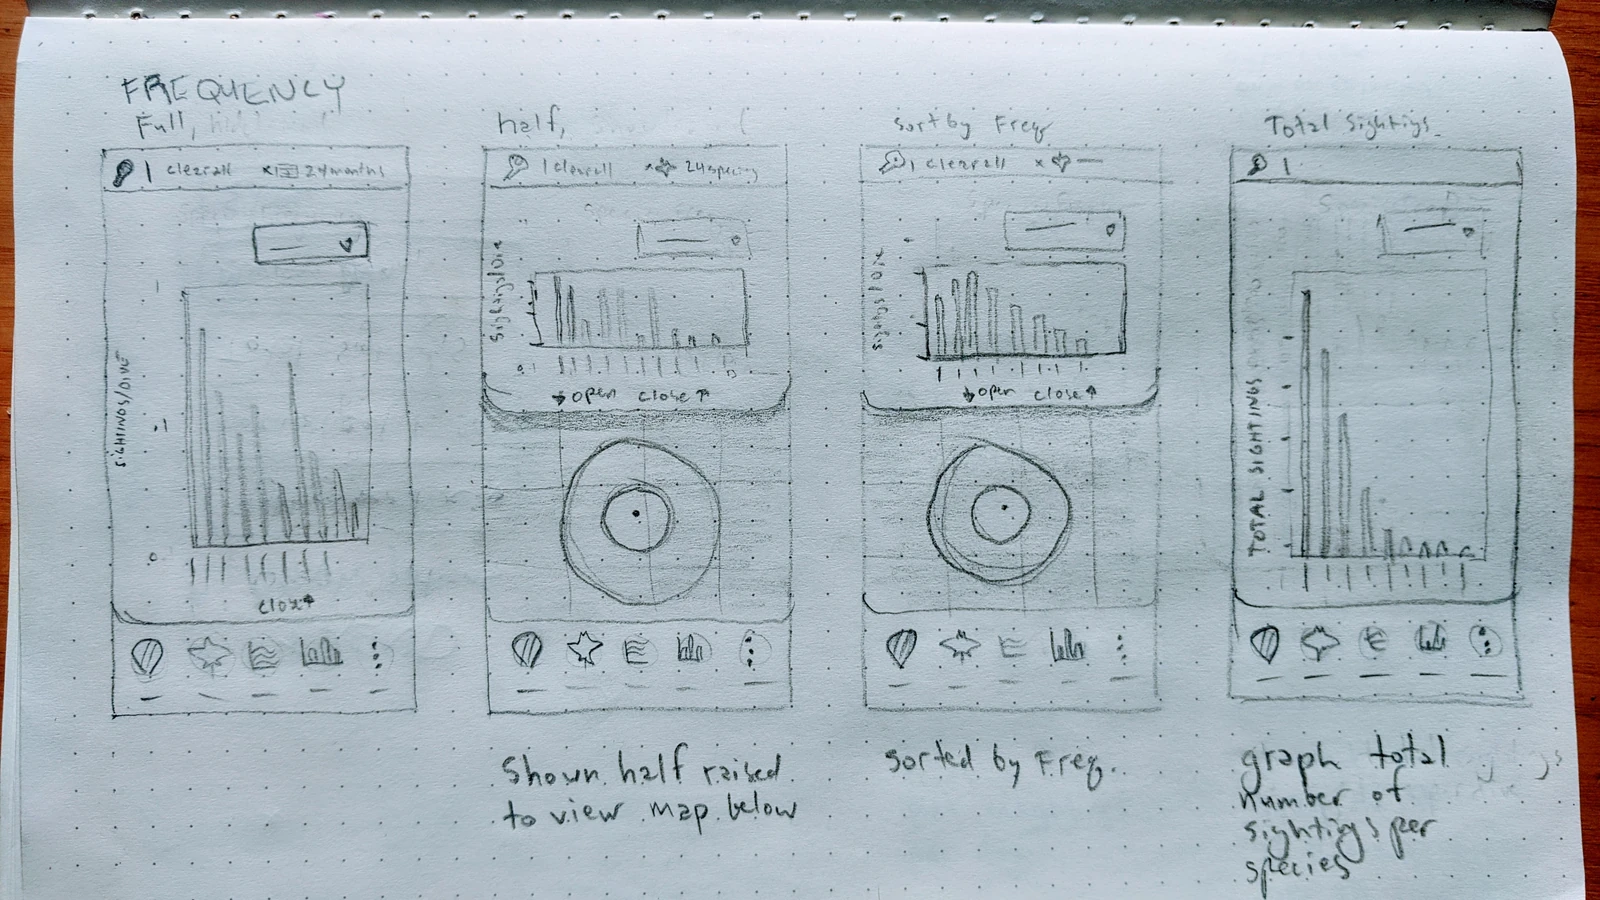
I added guidance for selecting species, sites, and groups of records, and resetting views. Paper studies explored metrics such as total sightings and sightings per dive.
From observations to shared views
Plotly and Dash coordinated the visualizations, supported by a wider workflow:
- Field records: dive-center teams recorded observations during the debrief.
- Curation: research assistants transcribed and collated the sightings.
- Exploration: linked charts let contributors and researchers investigate the collected records by site, species, and time.
Useful charts depended on practical collection methods and on returning insights to the people contributing records.
Growing through participation
By late 2018, the pilot included Tofo, Bali, and Komodo. I continued visiting and training dive-center teams across five global regions.
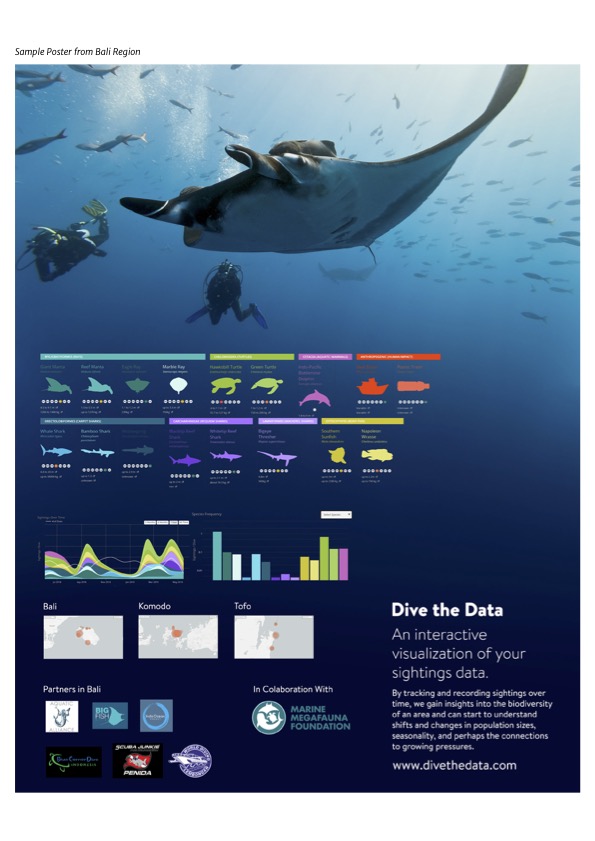
The Bali poster introduced the project to dive centers and guests through species guides, charts, regional maps, and local partners.
Related fieldwork
Marine megafauna research in Mozambique: the field experience behind the work.